

264
C. Morrow et al.
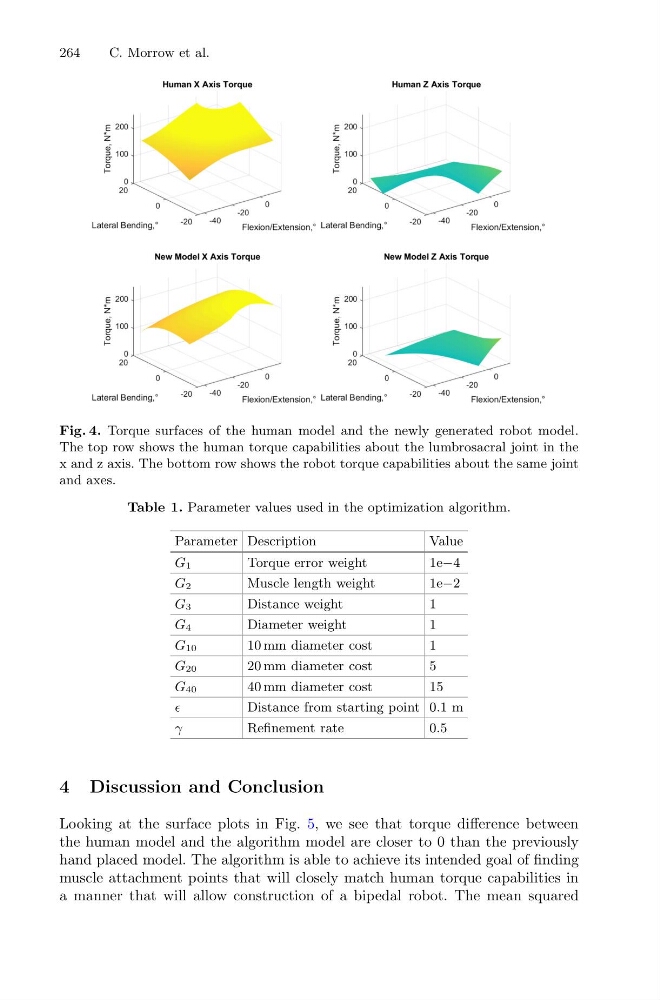
Fig. 4. Torque surfaces of the human model and the newly generated robot model.
The top row shows the human torque capabilities about the lumbrosacral joint in the
x and z axis. The bottom row shows the robot torque capabilities about the same joint
and axes.
Table 1. Parameter values used in the optimization algorithm.
Parameter Description
Value
G1
Torque error weight
1e−4
G2
Muscle length weight
1e−2
G3
Distance weight
1
G4
Diameter weight
1
G10
10 mm diameter cost
1
G20
20 mm diameter cost
5
G40
40 mm diameter cost
15
Distance from starting point 0.1 m
γ
Refinement rate
0.5
4 Discussion and Conclusion
Looking at the surface plots in Fig. 5, we see that torque difference between
the human model and the algorithm model are closer to 0 than the previously
hand placed model. The algorithm is able to achieve its intended goal of finding
muscle attachment points that will closely match human torque capabilities in
a manner that will allow construction of a bipedal robot. The mean squared
C. Morrow et al.
Fig. 4. Torque surfaces of the human model and the newly generated robot model.
The top row shows the human torque capabilities about the lumbrosacral joint in the
x and z axis. The bottom row shows the robot torque capabilities about the same joint
and axes.
Table 1. Parameter values used in the optimization algorithm.
Parameter Description
Value
G1
Torque error weight
1e−4
G2
Muscle length weight
1e−2
G3
Distance weight
1
G4
Diameter weight
1
G10
10 mm diameter cost
1
G20
20 mm diameter cost
5
G40
40 mm diameter cost
15
Distance from starting point 0.1 m
γ
Refinement rate
0.5
4 Discussion and Conclusion
Looking at the surface plots in Fig. 5, we see that torque difference between
the human model and the algorithm model are closer to 0 than the previously
hand placed model. The algorithm is able to achieve its intended goal of finding
muscle attachment points that will closely match human torque capabilities in
a manner that will allow construction of a bipedal robot. The mean squared