

Biohybrid Wind Energy Generators Based on Living Plants
241
Figure 3 eg. shows the individual oscillations of the plant (green) and the artificial
leaf (blue). The phase and frequency of both leaf oscillations describe very similar curves
and the amplitude of both increases with increasing wind speed. The bar codes in the
graphs indicate the events in the vibrational profiles when the plant leaf moves upwards
and the artificial leaf moves simultaneously downwards that were found by analyzing
the local derivatives of the vibrational profiles. Such events lead expectedly to contact
followed by separation and this is required for effective contact electrification. It can be
seen that the frequency of these events increases with the wind speeds similar to that
previously observed for the voltage peaks.
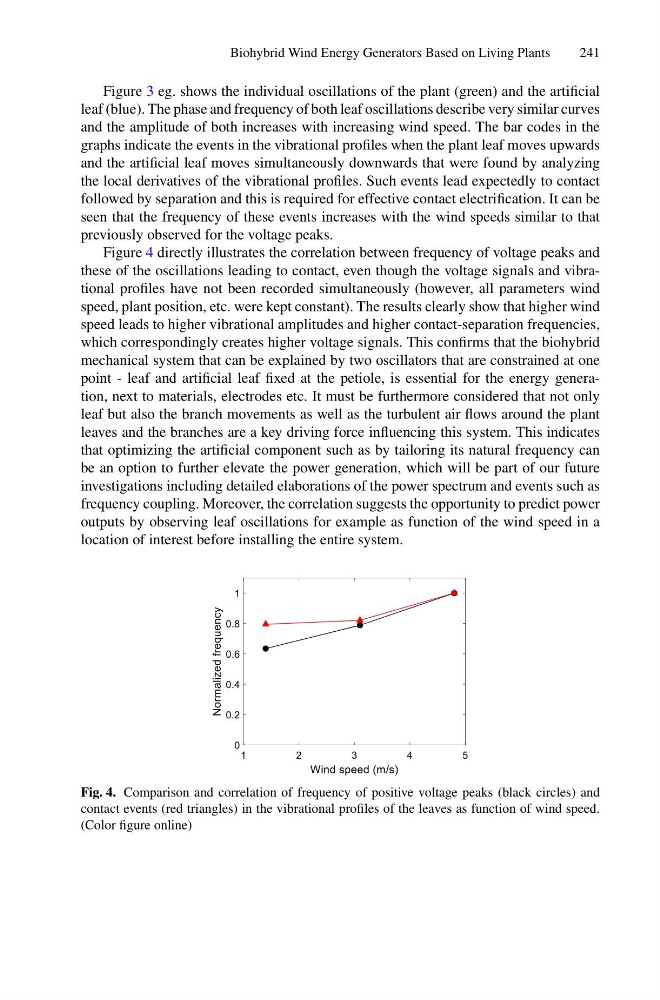
Figure 4 directly illustrates the correlation between frequency of voltage peaks and
these of the oscillations leading to contact, even though the voltage signals and vibrational profiles have not been recorded simultaneously (however, all parameters wind
speed, plant position, etc. were kept constant). The results clearly show that higher wind
speed leads to higher vibrational amplitudes and higher contact-separation frequencies,
which correspondingly creates higher voltage signals. This confirms that the biohybrid
mechanical system that can be explained by two oscillators that are constrained at one
point - leaf and artificial leaf fixed at the petiole, is essential for the energy generation, next to materials, electrodes etc. It must be furthermore considered that not only
leaf but also the branch movements as well as the turbulent air flows around the plant
leaves and the branches are a key driving force influencing this system. This indicates
that optimizing the artificial component such as by tailoring its natural frequency can
be an option to further elevate the power generation, which will be part of our future
investigations including detailed elaborations of the power spectrum and events such as
frequency coupling. Moreover, the correlation suggests the opportunity to predict power
outputs by observing leaf oscillations for example as function of the wind speed in a
location of interest before installing the entire system.
Fig. 4. Comparison and correlation of frequency of positive voltage peaks (black circles) and
contact events (red triangles) in the vibrational profiles of the leaves as function of wind speed.
(Color figure online)
241
Figure 3 eg. shows the individual oscillations of the plant (green) and the artificial
leaf (blue). The phase and frequency of both leaf oscillations describe very similar curves
and the amplitude of both increases with increasing wind speed. The bar codes in the
graphs indicate the events in the vibrational profiles when the plant leaf moves upwards
and the artificial leaf moves simultaneously downwards that were found by analyzing
the local derivatives of the vibrational profiles. Such events lead expectedly to contact
followed by separation and this is required for effective contact electrification. It can be
seen that the frequency of these events increases with the wind speeds similar to that
previously observed for the voltage peaks.
Figure 4 directly illustrates the correlation between frequency of voltage peaks and
these of the oscillations leading to contact, even though the voltage signals and vibrational profiles have not been recorded simultaneously (however, all parameters wind
speed, plant position, etc. were kept constant). The results clearly show that higher wind
speed leads to higher vibrational amplitudes and higher contact-separation frequencies,
which correspondingly creates higher voltage signals. This confirms that the biohybrid
mechanical system that can be explained by two oscillators that are constrained at one
point - leaf and artificial leaf fixed at the petiole, is essential for the energy generation, next to materials, electrodes etc. It must be furthermore considered that not only
leaf but also the branch movements as well as the turbulent air flows around the plant
leaves and the branches are a key driving force influencing this system. This indicates
that optimizing the artificial component such as by tailoring its natural frequency can
be an option to further elevate the power generation, which will be part of our future
investigations including detailed elaborations of the power spectrum and events such as
frequency coupling. Moreover, the correlation suggests the opportunity to predict power
outputs by observing leaf oscillations for example as function of the wind speed in a
location of interest before installing the entire system.
Fig. 4. Comparison and correlation of frequency of positive voltage peaks (black circles) and
contact events (red triangles) in the vibrational profiles of the leaves as function of wind speed.
(Color figure online)