

240
F. Meder et al.
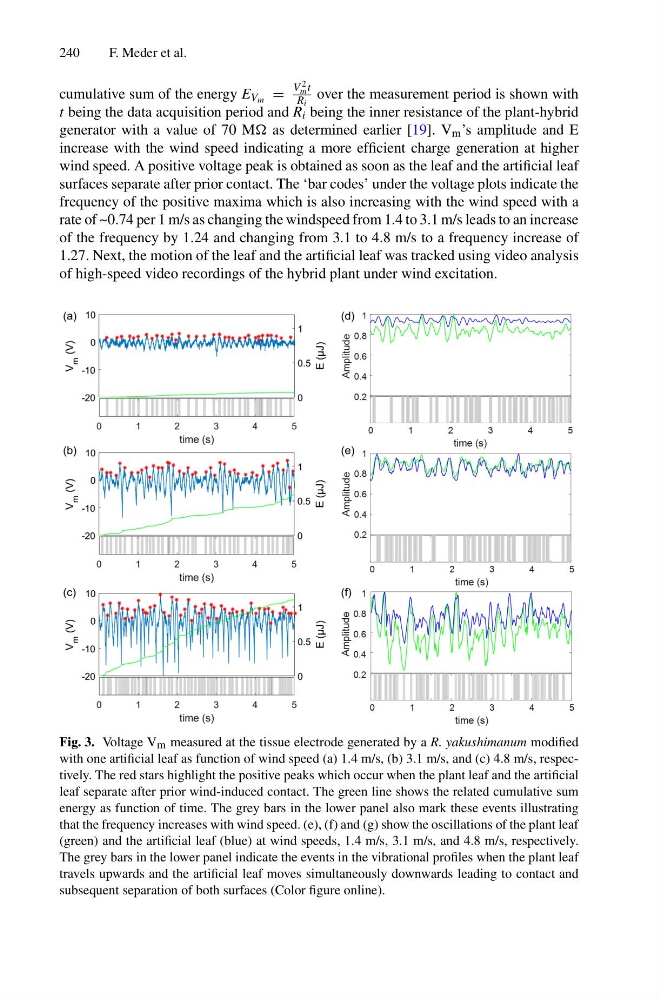
cumulative sum of the energy E V m =
V 2
m t
R i
over the measurement period is shown with
t being the data acquisition period and R i being the inner resistance of the plant-hybrid
generator with a value of 70 M as determined earlier [19]. V m ’s amplitude and E
increase with the wind speed indicating a more efficient charge generation at higher
wind speed. A positive voltage peak is obtained as soon as the leaf and the artificial leaf
surfaces separate after prior contact. The ‘bar codes’ under the voltage plots indicate the
frequency of the positive maxima which is also increasing with the wind speed with a
rate of ~0.74 per 1 m/s as changing the windspeed from 1.4 to 3.1 m/s leads to an increase
of the frequency by 1.24 and changing from 3.1 to 4.8 m/s to a frequency increase of
1.27. Next, the motion of the leaf and the artificial leaf was tracked using video analysis
of high-speed video recordings of the hybrid plant under wind excitation.
Fig. 3. Voltage V m measured at the tissue electrode generated by a R. yakushimanum modified
with one artificial leaf as function of wind speed (a) 1.4 m/s, (b) 3.1 m/s, and (c) 4.8 m/s, respectively. The red stars highlight the positive peaks which occur when the plant leaf and the artificial
leaf separate after prior wind-induced contact. The green line shows the related cumulative sum
energy as function of time. The grey bars in the lower panel also mark these events illustrating
that the frequency increases with wind speed. (e), (f) and (g) show the oscillations of the plant leaf
(green) and the artificial leaf (blue) at wind speeds, 1.4 m/s, 3.1 m/s, and 4.8 m/s, respectively.
The grey bars in the lower panel indicate the events in the vibrational profiles when the plant leaf
travels upwards and the artificial leaf moves simultaneously downwards leading to contact and
subsequent separation of both surfaces (Color figure online).
F. Meder et al.
cumulative sum of the energy E V m =
V 2
m t
R i
over the measurement period is shown with
t being the data acquisition period and R i being the inner resistance of the plant-hybrid
generator with a value of 70 M as determined earlier [19]. V m ’s amplitude and E
increase with the wind speed indicating a more efficient charge generation at higher
wind speed. A positive voltage peak is obtained as soon as the leaf and the artificial leaf
surfaces separate after prior contact. The ‘bar codes’ under the voltage plots indicate the
frequency of the positive maxima which is also increasing with the wind speed with a
rate of ~0.74 per 1 m/s as changing the windspeed from 1.4 to 3.1 m/s leads to an increase
of the frequency by 1.24 and changing from 3.1 to 4.8 m/s to a frequency increase of
1.27. Next, the motion of the leaf and the artificial leaf was tracked using video analysis
of high-speed video recordings of the hybrid plant under wind excitation.
Fig. 3. Voltage V m measured at the tissue electrode generated by a R. yakushimanum modified
with one artificial leaf as function of wind speed (a) 1.4 m/s, (b) 3.1 m/s, and (c) 4.8 m/s, respectively. The red stars highlight the positive peaks which occur when the plant leaf and the artificial
leaf separate after prior wind-induced contact. The green line shows the related cumulative sum
energy as function of time. The grey bars in the lower panel also mark these events illustrating
that the frequency increases with wind speed. (e), (f) and (g) show the oscillations of the plant leaf
(green) and the artificial leaf (blue) at wind speeds, 1.4 m/s, 3.1 m/s, and 4.8 m/s, respectively.
The grey bars in the lower panel indicate the events in the vibrational profiles when the plant leaf
travels upwards and the artificial leaf moves simultaneously downwards leading to contact and
subsequent separation of both surfaces (Color figure online).