

6
N. Andreakos et al.
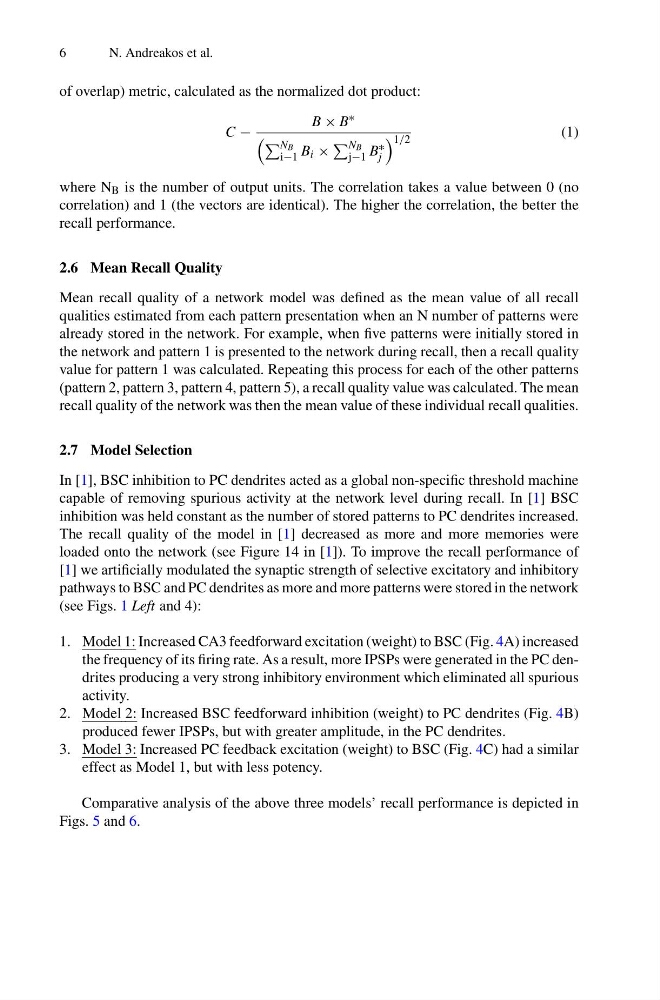
of overlap) metric, calculated as the normalized dot product:
C −
B × B ∗
N B
i−1 B i ×
N B
j−1 B ∗
j
1/2
(1)
where N B is the number of output units. The correlation takes a value between 0 (no
correlation) and 1 (the vectors are identical). The higher the correlation, the better the
recall performance.
2.6 Mean Recall Quality
Mean recall quality of a network model was defined as the mean value of all recall
qualities estimated from each pattern presentation when an N number of patterns were
already stored in the network. For example, when five patterns were initially stored in
the network and pattern 1 is presented to the network during recall, then a recall quality
value for pattern 1 was calculated. Repeating this process for each of the other patterns
(pattern 2, pattern 3, pattern 4, pattern 5), a recall quality value was calculated. The mean
recall quality of the network was then the mean value of these individual recall qualities.
2.7 Model Selection
In [1], BSC inhibition to PC dendrites acted as a global non-specific threshold machine
capable of removing spurious activity at the network level during recall. In [1] BSC
inhibition was held constant as the number of stored patterns to PC dendrites increased.
The recall quality of the model in [1] decreased as more and more memories were
loaded onto the network (see Figure 14 in [1]). To improve the recall performance of
[1] we artificially modulated the synaptic strength of selective excitatory and inhibitory
pathways to BSC and PC dendrites as more and more patterns were stored in the network
(see Figs. 1 Left and 4):
1. Model 1: Increased CA3 feedforward excitation (weight) to BSC (Fig. 4A) increased
the frequency of its firing rate. As a result, more IPSPs were generated in the PC dendrites producing a very strong inhibitory environment which eliminated all spurious
activity.
2. Model 2: Increased BSC feedforward inhibition (weight) to PC dendrites (Fig. 4B)
produced fewer IPSPs, but with greater amplitude, in the PC dendrites.
3. Model 3: Increased PC feedback excitation (weight) to BSC (Fig. 4C) had a similar
effect as Model 1, but with less potency.
Comparative analysis of the above three models’ recall performance is depicted in
Figs. 5 and 6.
N. Andreakos et al.
of overlap) metric, calculated as the normalized dot product:
C −
B × B ∗
N B
i−1 B i ×
N B
j−1 B ∗
j
1/2
(1)
where N B is the number of output units. The correlation takes a value between 0 (no
correlation) and 1 (the vectors are identical). The higher the correlation, the better the
recall performance.
2.6 Mean Recall Quality
Mean recall quality of a network model was defined as the mean value of all recall
qualities estimated from each pattern presentation when an N number of patterns were
already stored in the network. For example, when five patterns were initially stored in
the network and pattern 1 is presented to the network during recall, then a recall quality
value for pattern 1 was calculated. Repeating this process for each of the other patterns
(pattern 2, pattern 3, pattern 4, pattern 5), a recall quality value was calculated. The mean
recall quality of the network was then the mean value of these individual recall qualities.
2.7 Model Selection
In [1], BSC inhibition to PC dendrites acted as a global non-specific threshold machine
capable of removing spurious activity at the network level during recall. In [1] BSC
inhibition was held constant as the number of stored patterns to PC dendrites increased.
The recall quality of the model in [1] decreased as more and more memories were
loaded onto the network (see Figure 14 in [1]). To improve the recall performance of
[1] we artificially modulated the synaptic strength of selective excitatory and inhibitory
pathways to BSC and PC dendrites as more and more patterns were stored in the network
(see Figs. 1 Left and 4):
1. Model 1: Increased CA3 feedforward excitation (weight) to BSC (Fig. 4A) increased
the frequency of its firing rate. As a result, more IPSPs were generated in the PC dendrites producing a very strong inhibitory environment which eliminated all spurious
activity.
2. Model 2: Increased BSC feedforward inhibition (weight) to PC dendrites (Fig. 4B)
produced fewer IPSPs, but with greater amplitude, in the PC dendrites.
3. Model 3: Increased PC feedback excitation (weight) to BSC (Fig. 4C) had a similar
effect as Model 1, but with less potency.
Comparative analysis of the above three models’ recall performance is depicted in
Figs. 5 and 6.