

16 Theoretical Foundations of Super-Resolution in Microspherical Nanoscopy
427
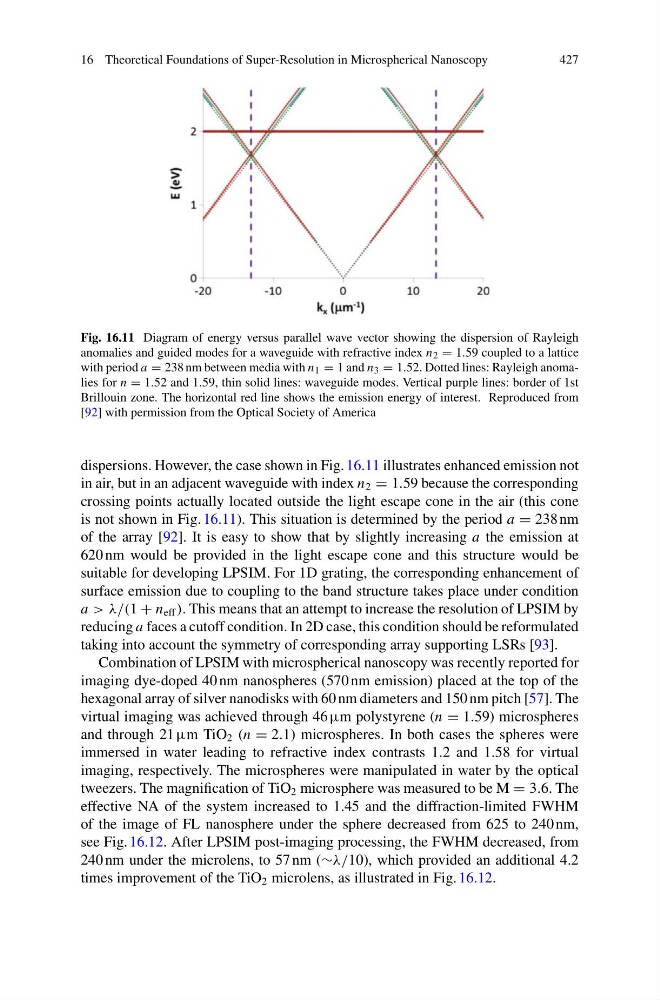
Fig. 16.11 Diagram of energy versus parallel wave vector showing the dispersion of Rayleigh
anomalies and guided modes for a waveguide with refractive index n 2 = 1.59 coupled to a lattice
with period a = 238 nm between media with n 1 = 1 and n 3 = 1.52. Dotted lines: Rayleigh anomalies for n = 1.52 and 1.59, thin solid lines: waveguide modes. Vertical purple lines: border of 1st
Brillouin zone. The horizontal red line shows the emission energy of interest. Reproduced from
[92] with permission from the Optical Society of America
dispersions. However, the case shown in Fig. 16.11 illustrates enhanced emission not
in air, but in an adjacent waveguide with index n 2 = 1.59 because the corresponding
crossing points actually located outside the light escape cone in the air (this cone
is not shown in Fig. 16.11). This situation is determined by the period a = 238 nm
of the array [92]. It is easy to show that by slightly increasing a the emission at
620 nm would be provided in the light escape cone and this structure would be
suitable for developing LPSIM. For 1D grating, the corresponding enhancement of
surface emission due to coupling to the band structure takes place under condition
a > λ/(1 + n eff ). This means that an attempt to increase the resolution of LPSIM by
reducing a faces a cutoff condition. In 2D case, this condition should be reformulated
taking into account the symmetry of corresponding array supporting LSRs [93].
Combination of LPSIM with microspherical nanoscopy was recently reported for
imaging dye-doped 40 nm nanospheres (570 nm emission) placed at the top of the
hexagonal array of silver nanodisks with 60 nm diameters and 150 nm pitch [57]. The
virtual imaging was achieved through 46 µm polystyrene (n = 1.59) microspheres
and through 21 µm TiO 2 (n = 2.1) microspheres. In both cases the spheres were
immersed in water leading to refractive index contrasts 1.2 and 1.58 for virtual
imaging, respectively. The microspheres were manipulated in water by the optical
tweezers. The magnification of TiO 2 microsphere was measured to be M = 3.6. The
effective NA of the system increased to 1.45 and the diffraction-limited FWHM
of the image of FL nanosphere under the sphere decreased from 625 to 240 nm,
see Fig. 16.12. After LPSIM post-imaging processing, the FWHM decreased, from
240 nm under the microlens, to 57 nm (∼λ/10), which provided an additional 4.2
times improvement of the TiO 2 microlens, as illustrated in Fig. 16.12.
427
Fig. 16.11 Diagram of energy versus parallel wave vector showing the dispersion of Rayleigh
anomalies and guided modes for a waveguide with refractive index n 2 = 1.59 coupled to a lattice
with period a = 238 nm between media with n 1 = 1 and n 3 = 1.52. Dotted lines: Rayleigh anomalies for n = 1.52 and 1.59, thin solid lines: waveguide modes. Vertical purple lines: border of 1st
Brillouin zone. The horizontal red line shows the emission energy of interest. Reproduced from
[92] with permission from the Optical Society of America
dispersions. However, the case shown in Fig. 16.11 illustrates enhanced emission not
in air, but in an adjacent waveguide with index n 2 = 1.59 because the corresponding
crossing points actually located outside the light escape cone in the air (this cone
is not shown in Fig. 16.11). This situation is determined by the period a = 238 nm
of the array [92]. It is easy to show that by slightly increasing a the emission at
620 nm would be provided in the light escape cone and this structure would be
suitable for developing LPSIM. For 1D grating, the corresponding enhancement of
surface emission due to coupling to the band structure takes place under condition
a > λ/(1 + n eff ). This means that an attempt to increase the resolution of LPSIM by
reducing a faces a cutoff condition. In 2D case, this condition should be reformulated
taking into account the symmetry of corresponding array supporting LSRs [93].
Combination of LPSIM with microspherical nanoscopy was recently reported for
imaging dye-doped 40 nm nanospheres (570 nm emission) placed at the top of the
hexagonal array of silver nanodisks with 60 nm diameters and 150 nm pitch [57]. The
virtual imaging was achieved through 46 µm polystyrene (n = 1.59) microspheres
and through 21 µm TiO 2 (n = 2.1) microspheres. In both cases the spheres were
immersed in water leading to refractive index contrasts 1.2 and 1.58 for virtual
imaging, respectively. The microspheres were manipulated in water by the optical
tweezers. The magnification of TiO 2 microsphere was measured to be M = 3.6. The
effective NA of the system increased to 1.45 and the diffraction-limited FWHM
of the image of FL nanosphere under the sphere decreased from 625 to 240 nm,
see Fig. 16.12. After LPSIM post-imaging processing, the FWHM decreased, from
240 nm under the microlens, to 57 nm (∼λ/10), which provided an additional 4.2
times improvement of the TiO 2 microlens, as illustrated in Fig. 16.12.