

426
A. V. Maslov and V. N. Astratov
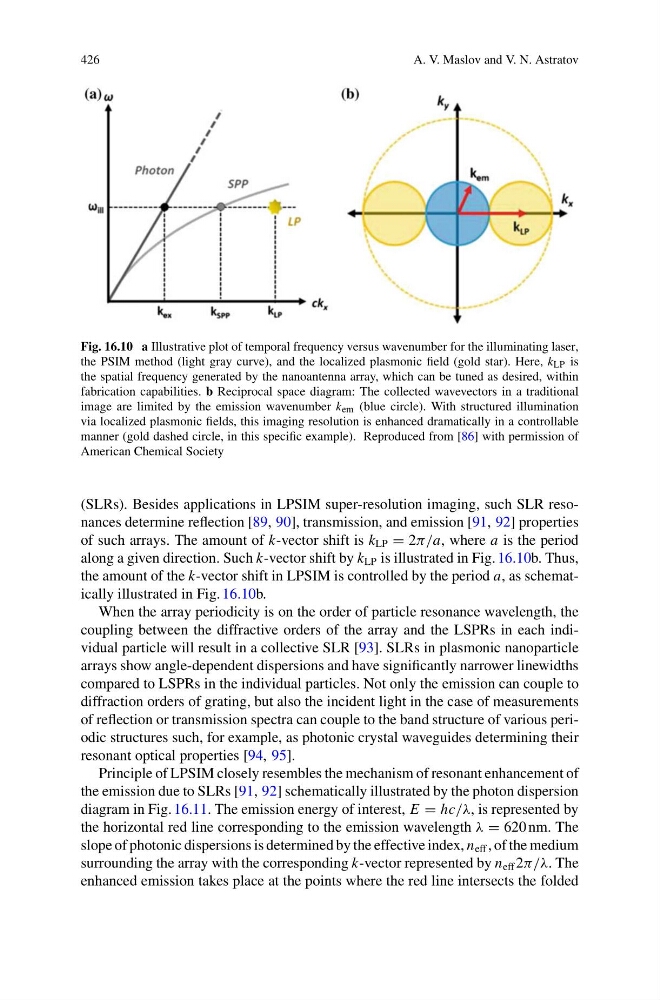
Fig. 16.10 a Illustrative plot of temporal frequency versus wavenumber for the illuminating laser,
the PSIM method (light gray curve), and the localized plasmonic field (gold star). Here, k LP is
the spatial frequency generated by the nanoantenna array, which can be tuned as desired, within
fabrication capabilities. b Reciprocal space diagram: The collected wavevectors in a traditional
image are limited by the emission wavenumber k em (blue circle). With structured illumination
via localized plasmonic fields, this imaging resolution is enhanced dramatically in a controllable
manner (gold dashed circle, in this specific example). Reproduced from [86] with permission of
American Chemical Society
(SLRs). Besides applications in LPSIM super-resolution imaging, such SLR resonances determine reflection [89, 90], transmission, and emission [91, 92] properties
of such arrays. The amount of k-vector shift is k LP = 2π/a, where a is the period
along a given direction. Such k-vector shift by k LP is illustrated in Fig. 16.10b. Thus,
the amount of the k-vector shift in LPSIM is controlled by the period a, as schematically illustrated in Fig. 16.10b.
When the array periodicity is on the order of particle resonance wavelength, the
coupling between the diffractive orders of the array and the LSPRs in each individual particle will result in a collective SLR [93]. SLRs in plasmonic nanoparticle
arrays show angle-dependent dispersions and have significantly narrower linewidths
compared to LSPRs in the individual particles. Not only the emission can couple to
diffraction orders of grating, but also the incident light in the case of measurements
of reflection or transmission spectra can couple to the band structure of various periodic structures such, for example, as photonic crystal waveguides determining their
resonant optical properties [94, 95].
Principle of LPSIM closely resembles the mechanism of resonant enhancement of
the emission due to SLRs [91, 92] schematically illustrated by the photon dispersion
diagram in Fig. 16.11. The emission energy of interest, E = hc/λ, is represented by
the horizontal red line corresponding to the emission wavelength λ = 620 nm. The
slope of photonic dispersions is determined by the effective index, n eff , of the medium
surrounding the array with the corresponding k-vector represented by n eff 2π/λ. The
enhanced emission takes place at the points where the red line intersects the folded
A. V. Maslov and V. N. Astratov
Fig. 16.10 a Illustrative plot of temporal frequency versus wavenumber for the illuminating laser,
the PSIM method (light gray curve), and the localized plasmonic field (gold star). Here, k LP is
the spatial frequency generated by the nanoantenna array, which can be tuned as desired, within
fabrication capabilities. b Reciprocal space diagram: The collected wavevectors in a traditional
image are limited by the emission wavenumber k em (blue circle). With structured illumination
via localized plasmonic fields, this imaging resolution is enhanced dramatically in a controllable
manner (gold dashed circle, in this specific example). Reproduced from [86] with permission of
American Chemical Society
(SLRs). Besides applications in LPSIM super-resolution imaging, such SLR resonances determine reflection [89, 90], transmission, and emission [91, 92] properties
of such arrays. The amount of k-vector shift is k LP = 2π/a, where a is the period
along a given direction. Such k-vector shift by k LP is illustrated in Fig. 16.10b. Thus,
the amount of the k-vector shift in LPSIM is controlled by the period a, as schematically illustrated in Fig. 16.10b.
When the array periodicity is on the order of particle resonance wavelength, the
coupling between the diffractive orders of the array and the LSPRs in each individual particle will result in a collective SLR [93]. SLRs in plasmonic nanoparticle
arrays show angle-dependent dispersions and have significantly narrower linewidths
compared to LSPRs in the individual particles. Not only the emission can couple to
diffraction orders of grating, but also the incident light in the case of measurements
of reflection or transmission spectra can couple to the band structure of various periodic structures such, for example, as photonic crystal waveguides determining their
resonant optical properties [94, 95].
Principle of LPSIM closely resembles the mechanism of resonant enhancement of
the emission due to SLRs [91, 92] schematically illustrated by the photon dispersion
diagram in Fig. 16.11. The emission energy of interest, E = hc/λ, is represented by
the horizontal red line corresponding to the emission wavelength λ = 620 nm. The
slope of photonic dispersions is determined by the effective index, n eff , of the medium
surrounding the array with the corresponding k-vector represented by n eff 2π/λ. The
enhanced emission takes place at the points where the red line intersects the folded