

334
I. I. Smolyaninov and V. N. Smolyaninova
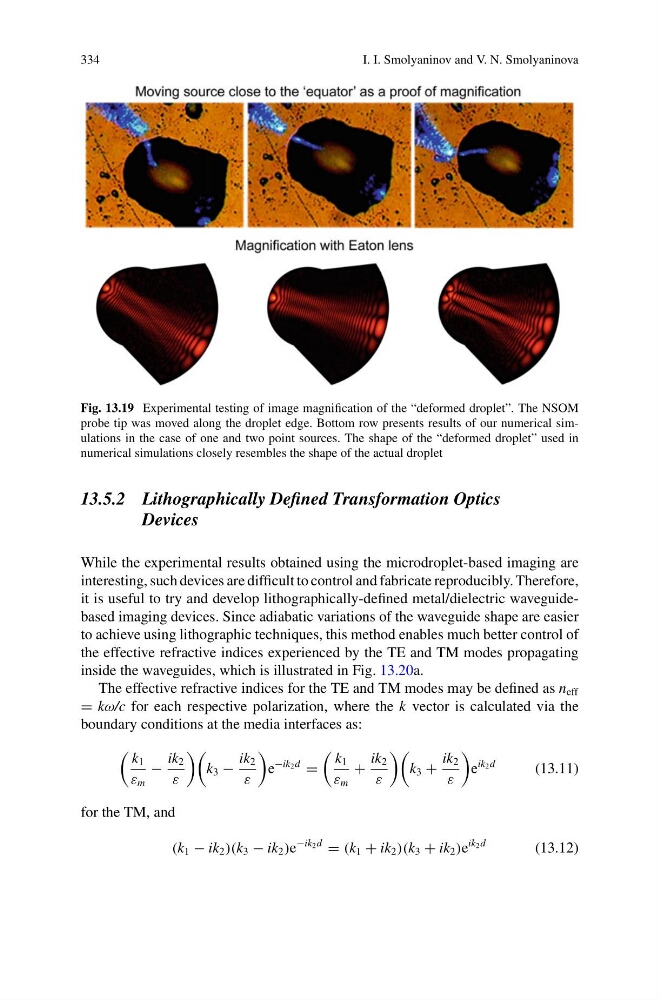
Fig. 13.19 Experimental testing of image magnification of the “deformed droplet”. The NSOM
probe tip was moved along the droplet edge. Bottom row presents results of our numerical simulations in the case of one and two point sources. The shape of the “deformed droplet” used in
numerical simulations closely resembles the shape of the actual droplet
13.5.2 Lithographically Defined Transformation Optics
Devices
While the experimental results obtained using the microdroplet-based imaging are
interesting, such devices are difficult to control and fabricate reproducibly. Therefore,
it is useful to try and develop lithographically-defined metal/dielectric waveguidebased imaging devices. Since adiabatic variations of the waveguide shape are easier
to achieve using lithographic techniques, this method enables much better control of
the effective refractive indices experienced by the TE and TM modes propagating
inside the waveguides, which is illustrated in Fig. 13.20a.
The effective refractive indices for the TE and TM modes may be defined as n eff
= kω/c for each respective polarization, where the k vector is calculated via the
boundary conditions at the media interfaces as:
k 1
ε m
−
ik 2
ε
k 3 −
ik 2
ε
e
−ik 2 d
=
k 1
ε m
+
ik 2
ε
k 3 +
ik 2
ε
e
ik 2 d
(13.11)
for the TM, and
(k 1 − ik 2 )(k 3 − ik 2 )e
−ik 2 d
= (k 1 + ik 2 )(k 3 + ik 2 )e
ik 2 d
(13.12)
I. I. Smolyaninov and V. N. Smolyaninova
Fig. 13.19 Experimental testing of image magnification of the “deformed droplet”. The NSOM
probe tip was moved along the droplet edge. Bottom row presents results of our numerical simulations in the case of one and two point sources. The shape of the “deformed droplet” used in
numerical simulations closely resembles the shape of the actual droplet
13.5.2 Lithographically Defined Transformation Optics
Devices
While the experimental results obtained using the microdroplet-based imaging are
interesting, such devices are difficult to control and fabricate reproducibly. Therefore,
it is useful to try and develop lithographically-defined metal/dielectric waveguidebased imaging devices. Since adiabatic variations of the waveguide shape are easier
to achieve using lithographic techniques, this method enables much better control of
the effective refractive indices experienced by the TE and TM modes propagating
inside the waveguides, which is illustrated in Fig. 13.20a.
The effective refractive indices for the TE and TM modes may be defined as n eff
= kω/c for each respective polarization, where the k vector is calculated via the
boundary conditions at the media interfaces as:
k 1
ε m
−
ik 2
ε
k 3 −
ik 2
ε
e
−ik 2 d
=
k 1
ε m
+
ik 2
ε
k 3 +
ik 2
ε
e
ik 2 d
(13.11)
for the TM, and
(k 1 − ik 2 )(k 3 − ik 2 )e
−ik 2 d
= (k 1 + ik 2 )(k 3 + ik 2 )e
ik 2 d
(13.12)