

10 Super-Resolution Imaging Based on Nonlinear Plasmonic Scattering
247
More specifically, since there is no nonlinearity in the edge (the blue dotted line),
the emission should follow the sinusoidal modulation, as shown in the top curve
of Fig. 10.1b. On the other hand, in the centre of focus, the excitation intensity is
strong enough to induce saturation, so the corresponding emission in the bottom
curve of Fig. 10.1b shows saturated modulation. By taking Fourier transform of
the temporal curves, Fig. 10.1c shows their frequency components. Apparently, with
linear response (the bottom one), only 1f component is observed, but in the nonlinear
part, higher harmonics are found. Therefore, by taking the higher harmonics, the
resulting PSF can be effectively reduced, leading to resolution enhancement, as
shown in Fig. 10.1d. Subsequent laser scanning is necessary to form an image.
The high background elimination property of SAX allows us to observe deep
finer structures in a thick sample with high spatial resolution and imaging contrast.
However, the requirement of the high excitation intensity does limit the achievable
spatial resolution because of photo-bleaching effects and the resultant decrease in
signal-to-noise ratio in emission detection [38].
10.2.2 All-Optical Switching + Spatial Modulation +
Saturation: STED
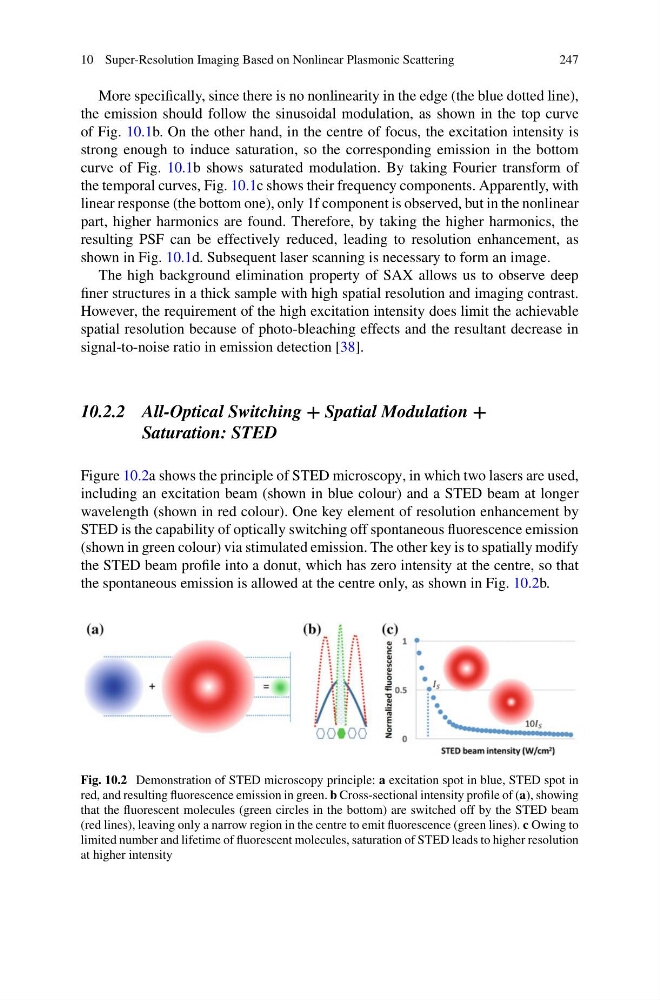
Figure 10.2a shows the principle of STED microscopy, in which two lasers are used,
including an excitation beam (shown in blue colour) and a STED beam at longer
wavelength (shown in red colour). One key element of resolution enhancement by
STED is the capability of optically switching off spontaneous fluorescence emission
(shown in green colour) via stimulated emission. The other key is to spatially modify
the STED beam profile into a donut, which has zero intensity at the centre, so that
the spontaneous emission is allowed at the centre only, as shown in Fig. 10.2b.
Fig. 10.2 Demonstration of STED microscopy principle: a excitation spot in blue, STED spot in
red, and resulting fluorescence emission in green. b Cross-sectional intensity profile of (a), showing
that the fluorescent molecules (green circles in the bottom) are switched off by the STED beam
(red lines), leaving only a narrow region in the centre to emit fluorescence (green lines). c Owing to
limited number and lifetime of fluorescent molecules, saturation of STED leads to higher resolution
at higher intensity
247
More specifically, since there is no nonlinearity in the edge (the blue dotted line),
the emission should follow the sinusoidal modulation, as shown in the top curve
of Fig. 10.1b. On the other hand, in the centre of focus, the excitation intensity is
strong enough to induce saturation, so the corresponding emission in the bottom
curve of Fig. 10.1b shows saturated modulation. By taking Fourier transform of
the temporal curves, Fig. 10.1c shows their frequency components. Apparently, with
linear response (the bottom one), only 1f component is observed, but in the nonlinear
part, higher harmonics are found. Therefore, by taking the higher harmonics, the
resulting PSF can be effectively reduced, leading to resolution enhancement, as
shown in Fig. 10.1d. Subsequent laser scanning is necessary to form an image.
The high background elimination property of SAX allows us to observe deep
finer structures in a thick sample with high spatial resolution and imaging contrast.
However, the requirement of the high excitation intensity does limit the achievable
spatial resolution because of photo-bleaching effects and the resultant decrease in
signal-to-noise ratio in emission detection [38].
10.2.2 All-Optical Switching + Spatial Modulation +
Saturation: STED
Figure 10.2a shows the principle of STED microscopy, in which two lasers are used,
including an excitation beam (shown in blue colour) and a STED beam at longer
wavelength (shown in red colour). One key element of resolution enhancement by
STED is the capability of optically switching off spontaneous fluorescence emission
(shown in green colour) via stimulated emission. The other key is to spatially modify
the STED beam profile into a donut, which has zero intensity at the centre, so that
the spontaneous emission is allowed at the centre only, as shown in Fig. 10.2b.
Fig. 10.2 Demonstration of STED microscopy principle: a excitation spot in blue, STED spot in
red, and resulting fluorescence emission in green. b Cross-sectional intensity profile of (a), showing
that the fluorescent molecules (green circles in the bottom) are switched off by the STED beam
(red lines), leaving only a narrow region in the centre to emit fluorescence (green lines). c Owing to
limited number and lifetime of fluorescent molecules, saturation of STED leads to higher resolution
at higher intensity