

9 Usage of Silicon for Label-Free Super-Resolved Imaging
233
where R is the reflectivity of F-P planes from both sides of the slab; α and n are
the silicon absorption coefficient and refractive index, respectively. The wavelength
of the probe is designated with λ and d is the absorption depth + diffusion length. L
is the silicon sample thickness. α and n are defined in (9.1) and (9.2).
b. Discussions
There is some uncertainty regarding the size of the FCC volume induced by the pump
beam because of the FCC diffusion [37–39]. For the temporal duration of the pump
beam that we use, which was 17 ns, we assume diffusion of ~10 μm for the FCC into
the silicon. This value includes 1.3 μm for the penetration depth of the 532 nm pump
photons, and 8 μm diffusion depth that was calculated for diffusion coefficient of
36 cm
2 /s for electrons in silicon during the 17 ns of the pump pulse. We assume high
quantum efficiency such that each photon that penetrates into the silicon creates an
e-h pair. The e-h pair recombination time is >100 ns [34, 36] and it does not affect
the FCC concentration during the pump pulse duration.
The maximum flounce used was 0.2 J/cm
2 , which is lower by a factor of ~10 than
the damage threshold for silicon [40]. Under the above assumptions, the flounce
intensity for the pump beam creates FCC density of ~0
20 cm
−3 .
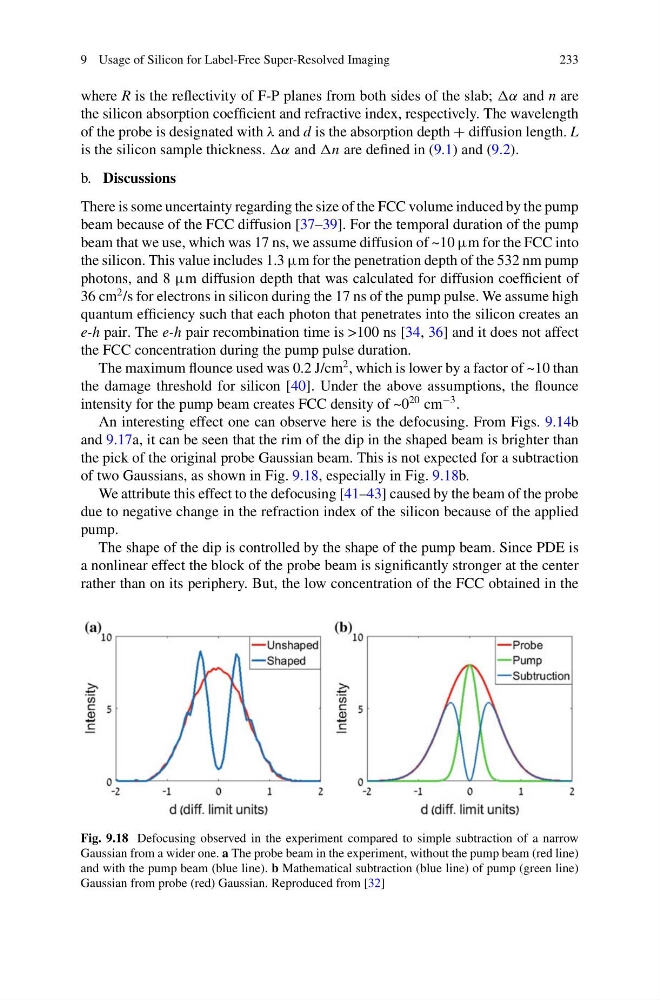
An interesting effect one can observe here is the defocusing. From Figs. 9.14b
and 9.17a, it can be seen that the rim of the dip in the shaped beam is brighter than
the pick of the original probe Gaussian beam. This is not expected for a subtraction
of two Gaussians, as shown in Fig. 9.18, especially in Fig. 9.18b.
We attribute this effect to the defocusing [41–43] caused by the beam of the probe
due to negative change in the refraction index of the silicon because of the applied
pump.
The shape of the dip is controlled by the shape of the pump beam. Since PDE is
a nonlinear effect the block of the probe beam is significantly stronger at the center
rather than on its periphery. But, the low concentration of the FCC obtained in the
Fig. 9.18 Defocusing observed in the experiment compared to simple subtraction of a narrow
Gaussian from a wider one. a The probe beam in the experiment, without the pump beam (red line)
and with the pump beam (blue line). b Mathematical subtraction (blue line) of pump (green line)
Gaussian from probe (red) Gaussian. Reproduced from [32]
233
where R is the reflectivity of F-P planes from both sides of the slab; α and n are
the silicon absorption coefficient and refractive index, respectively. The wavelength
of the probe is designated with λ and d is the absorption depth + diffusion length. L
is the silicon sample thickness. α and n are defined in (9.1) and (9.2).
b. Discussions
There is some uncertainty regarding the size of the FCC volume induced by the pump
beam because of the FCC diffusion [37–39]. For the temporal duration of the pump
beam that we use, which was 17 ns, we assume diffusion of ~10 μm for the FCC into
the silicon. This value includes 1.3 μm for the penetration depth of the 532 nm pump
photons, and 8 μm diffusion depth that was calculated for diffusion coefficient of
36 cm
2 /s for electrons in silicon during the 17 ns of the pump pulse. We assume high
quantum efficiency such that each photon that penetrates into the silicon creates an
e-h pair. The e-h pair recombination time is >100 ns [34, 36] and it does not affect
the FCC concentration during the pump pulse duration.
The maximum flounce used was 0.2 J/cm
2 , which is lower by a factor of ~10 than
the damage threshold for silicon [40]. Under the above assumptions, the flounce
intensity for the pump beam creates FCC density of ~0
20 cm
−3 .
An interesting effect one can observe here is the defocusing. From Figs. 9.14b
and 9.17a, it can be seen that the rim of the dip in the shaped beam is brighter than
the pick of the original probe Gaussian beam. This is not expected for a subtraction
of two Gaussians, as shown in Fig. 9.18, especially in Fig. 9.18b.
We attribute this effect to the defocusing [41–43] caused by the beam of the probe
due to negative change in the refraction index of the silicon because of the applied
pump.
The shape of the dip is controlled by the shape of the pump beam. Since PDE is
a nonlinear effect the block of the probe beam is significantly stronger at the center
rather than on its periphery. But, the low concentration of the FCC obtained in the
Fig. 9.18 Defocusing observed in the experiment compared to simple subtraction of a narrow
Gaussian from a wider one. a The probe beam in the experiment, without the pump beam (red line)
and with the pump beam (blue line). b Mathematical subtraction (blue line) of pump (green line)
Gaussian from probe (red) Gaussian. Reproduced from [32]