

232
H. Pinhas et al.
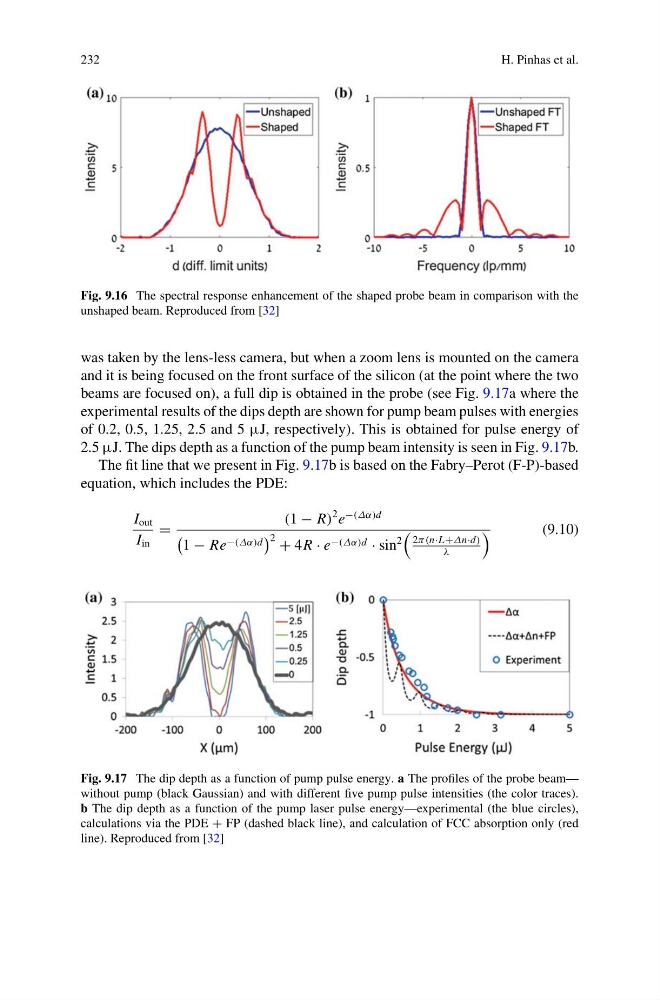
Fig. 9.16 The spectral response enhancement of the shaped probe beam in comparison with the
unshaped beam. Reproduced from [32]
was taken by the lens-less camera, but when a zoom lens is mounted on the camera
and it is being focused on the front surface of the silicon (at the point where the two
beams are focused on), a full dip is obtained in the probe (see Fig. 9.17a where the
experimental results of the dips depth are shown for pump beam pulses with energies
of 0.2, 0.5, 1.25, 2.5 and 5 μJ, respectively). This is obtained for pulse energy of
2.5 μJ. The dips depth as a function of the pump beam intensity is seen in Fig. 9.17b.
The fit line that we present in Fig. 9.17b is based on the Fabry–Perot (F-P)-based
equation, which includes the PDE:
I out
I in
=
(1 − R)
2 e
−(Δα)d
1 − Re −(Δα)d
2 + 4R · e −(Δα)d · sin
2
2π(n·L+Δn·d)
λ
(9.10)
Fig. 9.17 The dip depth as a function of pump pulse energy. a The profiles of the probe beam—
without pump (black Gaussian) and with different five pump pulse intensities (the color traces).
b The dip depth as a function of the pump laser pulse energy—experimental (the blue circles),
calculations via the PDE + FP (dashed black line), and calculation of FCC absorption only (red
line). Reproduced from [32]
H. Pinhas et al.
Fig. 9.16 The spectral response enhancement of the shaped probe beam in comparison with the
unshaped beam. Reproduced from [32]
was taken by the lens-less camera, but when a zoom lens is mounted on the camera
and it is being focused on the front surface of the silicon (at the point where the two
beams are focused on), a full dip is obtained in the probe (see Fig. 9.17a where the
experimental results of the dips depth are shown for pump beam pulses with energies
of 0.2, 0.5, 1.25, 2.5 and 5 μJ, respectively). This is obtained for pulse energy of
2.5 μJ. The dips depth as a function of the pump beam intensity is seen in Fig. 9.17b.
The fit line that we present in Fig. 9.17b is based on the Fabry–Perot (F-P)-based
equation, which includes the PDE:
I out
I in
=
(1 − R)
2 e
−(Δα)d
1 − Re −(Δα)d
2 + 4R · e −(Δα)d · sin
2
2π(n·L+Δn·d)
λ
(9.10)
Fig. 9.17 The dip depth as a function of pump pulse energy. a The profiles of the probe beam—
without pump (black Gaussian) and with different five pump pulse intensities (the color traces).
b The dip depth as a function of the pump laser pulse energy—experimental (the blue circles),
calculations via the PDE + FP (dashed black line), and calculation of FCC absorption only (red
line). Reproduced from [32]