

220
H. Pinhas et al.
cross-section. Figure 9.3c–d shows the increase in the scattering cross-section, and
the decrease in the absorption cross-section when the volume of the nanoparticle
increases.
In the simulations that we show in this section, the probe wavelength of 750 nm at
the peak of the pump illumination was chosen because of the nanoparticle maximal
shift of the LSPR. This shift is relative to the marginal nanoparticles located at the
intensity of the tails of the illuminating Gaussian beam.
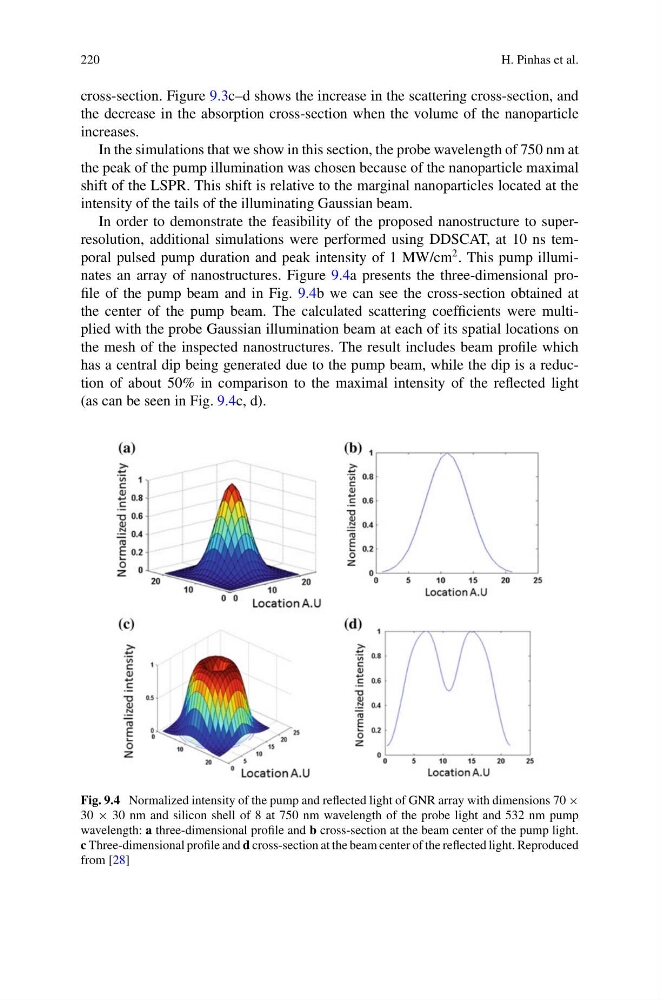
In order to demonstrate the feasibility of the proposed nanostructure to superresolution, additional simulations were performed using DDSCAT, at 10 ns temporal pulsed pump duration and peak intensity of 1 MW/cm
2 . This pump illuminates an array of nanostructures. Figure 9.4a presents the three-dimensional profile of the pump beam and in Fig. 9.4b we can see the cross-section obtained at
the center of the pump beam. The calculated scattering coefficients were multiplied with the probe Gaussian illumination beam at each of its spatial locations on
the mesh of the inspected nanostructures. The result includes beam profile which
has a central dip being generated due to the pump beam, while the dip is a reduction of about 50% in comparison to the maximal intensity of the reflected light
(as can be seen in Fig. 9.4c, d).
Fig. 9.4 Normalized intensity of the pump and reflected light of GNR array with dimensions 70 ×
30 × 30 nm and silicon shell of 8 at 750 nm wavelength of the probe light and 532 nm pump
wavelength: a three-dimensional profile and b cross-section at the beam center of the pump light.
c Three-dimensional profile and d cross-section at the beam center of the reflected light. Reproduced
from [28]
H. Pinhas et al.
cross-section. Figure 9.3c–d shows the increase in the scattering cross-section, and
the decrease in the absorption cross-section when the volume of the nanoparticle
increases.
In the simulations that we show in this section, the probe wavelength of 750 nm at
the peak of the pump illumination was chosen because of the nanoparticle maximal
shift of the LSPR. This shift is relative to the marginal nanoparticles located at the
intensity of the tails of the illuminating Gaussian beam.
In order to demonstrate the feasibility of the proposed nanostructure to superresolution, additional simulations were performed using DDSCAT, at 10 ns temporal pulsed pump duration and peak intensity of 1 MW/cm
2 . This pump illuminates an array of nanostructures. Figure 9.4a presents the three-dimensional profile of the pump beam and in Fig. 9.4b we can see the cross-section obtained at
the center of the pump beam. The calculated scattering coefficients were multiplied with the probe Gaussian illumination beam at each of its spatial locations on
the mesh of the inspected nanostructures. The result includes beam profile which
has a central dip being generated due to the pump beam, while the dip is a reduction of about 50% in comparison to the maximal intensity of the reflected light
(as can be seen in Fig. 9.4c, d).
Fig. 9.4 Normalized intensity of the pump and reflected light of GNR array with dimensions 70 ×
30 × 30 nm and silicon shell of 8 at 750 nm wavelength of the probe light and 532 nm pump
wavelength: a three-dimensional profile and b cross-section at the beam center of the pump light.
c Three-dimensional profile and d cross-section at the beam center of the reflected light. Reproduced
from [28]