

208
K. Fujita
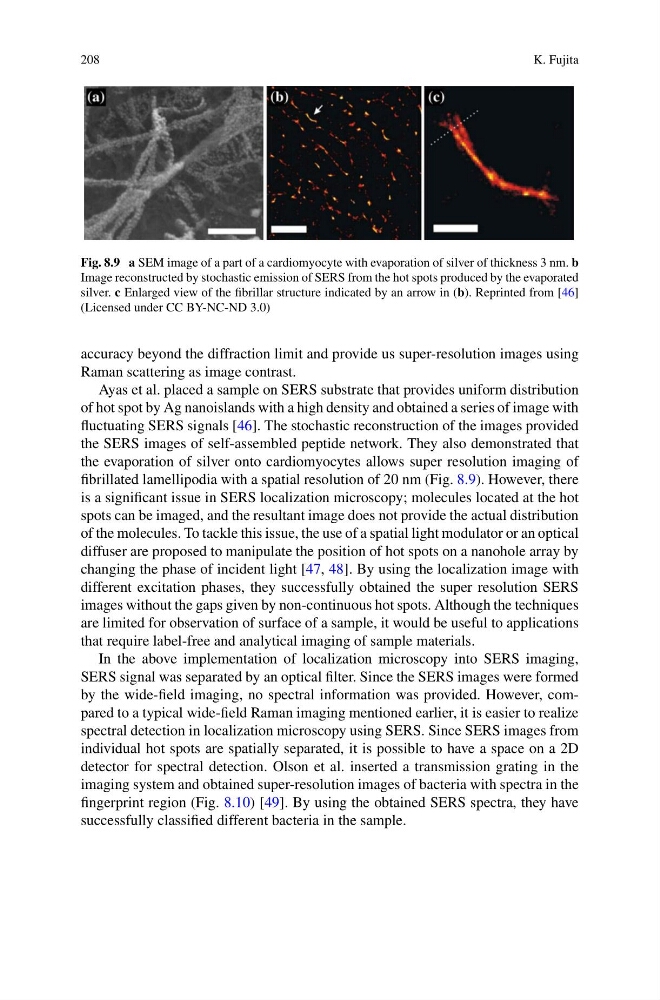
Fig. 8.9 a SEM image of a part of a cardiomyocyte with evaporation of silver of thickness 3 nm. b
Image reconstructed by stochastic emission of SERS from the hot spots produced by the evaporated
silver. c Enlarged view of the fibrillar structure indicated by an arrow in (b). Reprinted from [46]
(Licensed under CC BY-NC-ND 3.0)
accuracy beyond the diffraction limit and provide us super-resolution images using
Raman scattering as image contrast.
Ayas et al. placed a sample on SERS substrate that provides uniform distribution
of hot spot by Ag nanoislands with a high density and obtained a series of image with
fluctuating SERS signals [46]. The stochastic reconstruction of the images provided
the SERS images of self-assembled peptide network. They also demonstrated that
the evaporation of silver onto cardiomyocytes allows super resolution imaging of
fibrillated lamellipodia with a spatial resolution of 20 nm (Fig. 8.9). However, there
is a significant issue in SERS localization microscopy; molecules located at the hot
spots can be imaged, and the resultant image does not provide the actual distribution
of the molecules. To tackle this issue, the use of a spatial light modulator or an optical
diffuser are proposed to manipulate the position of hot spots on a nanohole array by
changing the phase of incident light [47, 48]. By using the localization image with
different excitation phases, they successfully obtained the super resolution SERS
images without the gaps given by non-continuous hot spots. Although the techniques
are limited for observation of surface of a sample, it would be useful to applications
that require label-free and analytical imaging of sample materials.
In the above implementation of localization microscopy into SERS imaging,
SERS signal was separated by an optical filter. Since the SERS images were formed
by the wide-field imaging, no spectral information was provided. However, compared to a typical wide-field Raman imaging mentioned earlier, it is easier to realize
spectral detection in localization microscopy using SERS. Since SERS images from
individual hot spots are spatially separated, it is possible to have a space on a 2D
detector for spectral detection. Olson et al. inserted a transmission grating in the
imaging system and obtained super-resolution images of bacteria with spectra in the
fingerprint region (Fig. 8.10) [49]. By using the obtained SERS spectra, they have
successfully classified different bacteria in the sample.
K. Fujita
Fig. 8.9 a SEM image of a part of a cardiomyocyte with evaporation of silver of thickness 3 nm. b
Image reconstructed by stochastic emission of SERS from the hot spots produced by the evaporated
silver. c Enlarged view of the fibrillar structure indicated by an arrow in (b). Reprinted from [46]
(Licensed under CC BY-NC-ND 3.0)
accuracy beyond the diffraction limit and provide us super-resolution images using
Raman scattering as image contrast.
Ayas et al. placed a sample on SERS substrate that provides uniform distribution
of hot spot by Ag nanoislands with a high density and obtained a series of image with
fluctuating SERS signals [46]. The stochastic reconstruction of the images provided
the SERS images of self-assembled peptide network. They also demonstrated that
the evaporation of silver onto cardiomyocytes allows super resolution imaging of
fibrillated lamellipodia with a spatial resolution of 20 nm (Fig. 8.9). However, there
is a significant issue in SERS localization microscopy; molecules located at the hot
spots can be imaged, and the resultant image does not provide the actual distribution
of the molecules. To tackle this issue, the use of a spatial light modulator or an optical
diffuser are proposed to manipulate the position of hot spots on a nanohole array by
changing the phase of incident light [47, 48]. By using the localization image with
different excitation phases, they successfully obtained the super resolution SERS
images without the gaps given by non-continuous hot spots. Although the techniques
are limited for observation of surface of a sample, it would be useful to applications
that require label-free and analytical imaging of sample materials.
In the above implementation of localization microscopy into SERS imaging,
SERS signal was separated by an optical filter. Since the SERS images were formed
by the wide-field imaging, no spectral information was provided. However, compared to a typical wide-field Raman imaging mentioned earlier, it is easier to realize
spectral detection in localization microscopy using SERS. Since SERS images from
individual hot spots are spatially separated, it is possible to have a space on a 2D
detector for spectral detection. Olson et al. inserted a transmission grating in the
imaging system and obtained super-resolution images of bacteria with spectra in the
fingerprint region (Fig. 8.10) [49]. By using the obtained SERS spectra, they have
successfully classified different bacteria in the sample.