

7 Label-Free Pump–Probe Nanoscopy
173
wavelength, and the delay time between the two pulses. The pump intensity needs to
be kept at a higher intensity with respect to the probe one, because it needs to induce a
measurable change in the carrier population, while the probe should simply monitor
this perturbation, without any additional effects. In this way, the pump–probe signal
will exhibit a “weak” nonlinearity, and its intensity will vary proportionally to the
product of pump and probe intensities, I pu and I pr , respectively, and to the analyte
concentration c [7, 8]
T ∝ cI pu I pr .
(7.2)
The overall quadratic dependence on the incident intensity marks the nonlinearity,
while the linear concentration dependence permits quantification.
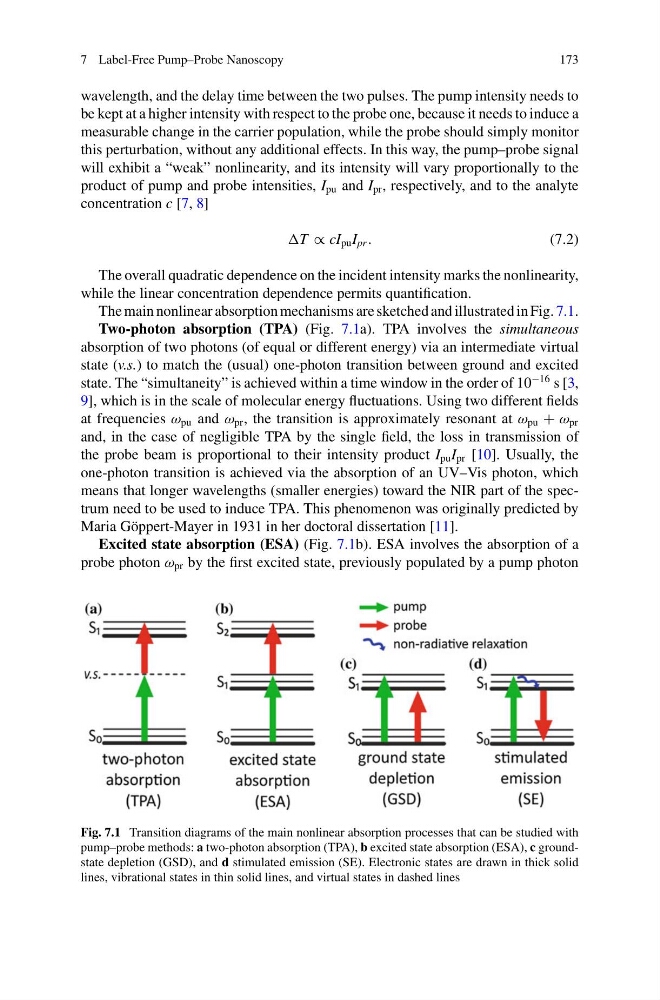
The main nonlinear absorption mechanisms are sketched and illustrated in Fig. 7.1.
Two-photon absorption (TPA) (Fig. 7.1a). TPA involves the simultaneous
absorption of two photons (of equal or different energy) via an intermediate virtual
state (v.s.) to match the (usual) one-photon transition between ground and excited
state. The “simultaneity” is achieved within a time window in the order of 10
−16 s [3,
9], which is in the scale of molecular energy fluctuations. Using two different fields
at frequencies ω pu and ω pr , the transition is approximately resonant at ω pu + ω pr
and, in the case of negligible TPA by the single field, the loss in transmission of
the probe beam is proportional to their intensity product I pu I pr [10]. Usually, the
one-photon transition is achieved via the absorption of an UV–Vis photon, which
means that longer wavelengths (smaller energies) toward the NIR part of the spectrum need to be used to induce TPA. This phenomenon was originally predicted by
Maria Göppert-Mayer in 1931 in her doctoral dissertation [11].
Excited state absorption (ESA) (Fig. 7.1b). ESA involves the absorption of a
probe photon ω pr by the first excited state, previously populated by a pump photon
Fig. 7.1 Transition diagrams of the main nonlinear absorption processes that can be studied with
pump–probe methods: a two-photon absorption (TPA), b excited state absorption (ESA), c groundstate depletion (GSD), and d stimulated emission (SE). Electronic states are drawn in thick solid
lines, vibrational states in thin solid lines, and virtual states in dashed lines
173
wavelength, and the delay time between the two pulses. The pump intensity needs to
be kept at a higher intensity with respect to the probe one, because it needs to induce a
measurable change in the carrier population, while the probe should simply monitor
this perturbation, without any additional effects. In this way, the pump–probe signal
will exhibit a “weak” nonlinearity, and its intensity will vary proportionally to the
product of pump and probe intensities, I pu and I pr , respectively, and to the analyte
concentration c [7, 8]
T ∝ cI pu I pr .
(7.2)
The overall quadratic dependence on the incident intensity marks the nonlinearity,
while the linear concentration dependence permits quantification.
The main nonlinear absorption mechanisms are sketched and illustrated in Fig. 7.1.
Two-photon absorption (TPA) (Fig. 7.1a). TPA involves the simultaneous
absorption of two photons (of equal or different energy) via an intermediate virtual
state (v.s.) to match the (usual) one-photon transition between ground and excited
state. The “simultaneity” is achieved within a time window in the order of 10
−16 s [3,
9], which is in the scale of molecular energy fluctuations. Using two different fields
at frequencies ω pu and ω pr , the transition is approximately resonant at ω pu + ω pr
and, in the case of negligible TPA by the single field, the loss in transmission of
the probe beam is proportional to their intensity product I pu I pr [10]. Usually, the
one-photon transition is achieved via the absorption of an UV–Vis photon, which
means that longer wavelengths (smaller energies) toward the NIR part of the spectrum need to be used to induce TPA. This phenomenon was originally predicted by
Maria Göppert-Mayer in 1931 in her doctoral dissertation [11].
Excited state absorption (ESA) (Fig. 7.1b). ESA involves the absorption of a
probe photon ω pr by the first excited state, previously populated by a pump photon
Fig. 7.1 Transition diagrams of the main nonlinear absorption processes that can be studied with
pump–probe methods: a two-photon absorption (TPA), b excited state absorption (ESA), c groundstate depletion (GSD), and d stimulated emission (SE). Electronic states are drawn in thick solid
lines, vibrational states in thin solid lines, and virtual states in dashed lines