

5 Near-Field Scanning Optical Microscope Combined with Digital …
125
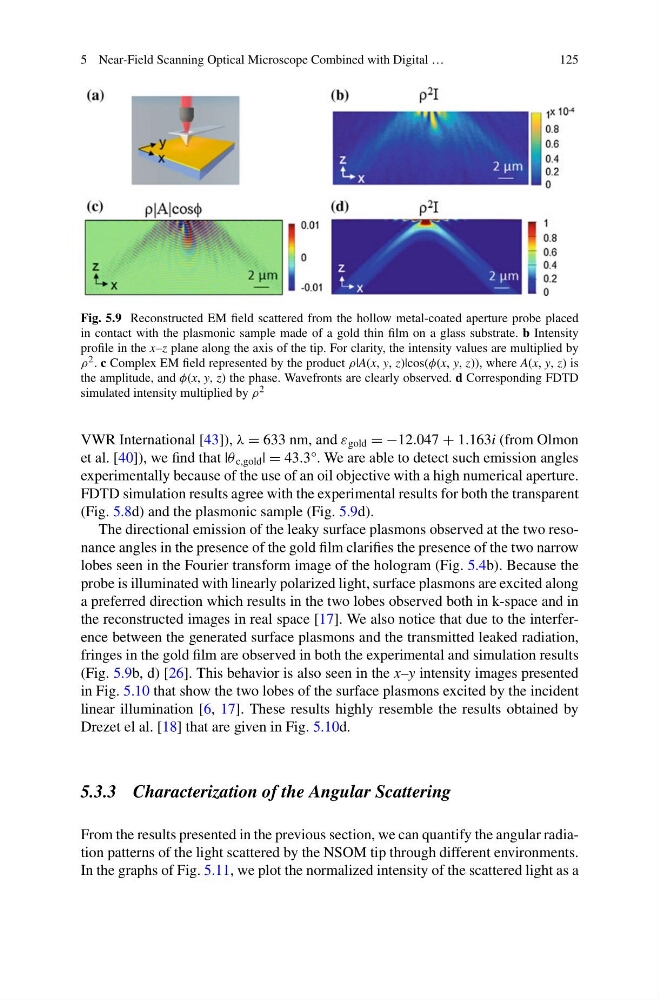
Fig. 5.9 Reconstructed EM field scattered from the hollow metal-coated aperture probe placed
in contact with the plasmonic sample made of a gold thin film on a glass substrate. b Intensity
profile in the x–z plane along the axis of the tip. For clarity, the intensity values are multiplied by
ρ 2 . c Complex EM field represented by the product ρ|A(x, y, z)|cos(φ(x, y, z)), where A(x, y, z) is
the amplitude, and φ(x, y, z) the phase. Wavefronts are clearly observed. d Corresponding FDTD
simulated intensity multiplied by ρ 2
VWR International [43]), λ = 633 nm, and ε gold = −12.047 + 1.163i (from Olmon
et al. [40]), we find that |θ c,gold | = 43.3°. We are able to detect such emission angles
experimentally because of the use of an oil objective with a high numerical aperture.
FDTD simulation results agree with the experimental results for both the transparent
(Fig. 5.8d) and the plasmonic sample (Fig. 5.9d).
The directional emission of the leaky surface plasmons observed at the two resonance angles in the presence of the gold film clarifies the presence of the two narrow
lobes seen in the Fourier transform image of the hologram (Fig. 5.4b). Because the
probe is illuminated with linearly polarized light, surface plasmons are excited along
a preferred direction which results in the two lobes observed both in k-space and in
the reconstructed images in real space [17]. We also notice that due to the interference between the generated surface plasmons and the transmitted leaked radiation,
fringes in the gold film are observed in both the experimental and simulation results
(Fig. 5.9b, d) [26]. This behavior is also seen in the x–y intensity images presented
in Fig. 5.10 that show the two lobes of the surface plasmons excited by the incident
linear illumination [6, 17]. These results highly resemble the results obtained by
Drezet el al. [18] that are given in Fig. 5.10d.
5.3.3 Characterization of the Angular Scattering
From the results presented in the previous section, we can quantify the angular radiation patterns of the light scattered by the NSOM tip through different environments.
In the graphs of Fig. 5.11, we plot the normalized intensity of the scattered light as a
125
Fig. 5.9 Reconstructed EM field scattered from the hollow metal-coated aperture probe placed
in contact with the plasmonic sample made of a gold thin film on a glass substrate. b Intensity
profile in the x–z plane along the axis of the tip. For clarity, the intensity values are multiplied by
ρ 2 . c Complex EM field represented by the product ρ|A(x, y, z)|cos(φ(x, y, z)), where A(x, y, z) is
the amplitude, and φ(x, y, z) the phase. Wavefronts are clearly observed. d Corresponding FDTD
simulated intensity multiplied by ρ 2
VWR International [43]), λ = 633 nm, and ε gold = −12.047 + 1.163i (from Olmon
et al. [40]), we find that |θ c,gold | = 43.3°. We are able to detect such emission angles
experimentally because of the use of an oil objective with a high numerical aperture.
FDTD simulation results agree with the experimental results for both the transparent
(Fig. 5.8d) and the plasmonic sample (Fig. 5.9d).
The directional emission of the leaky surface plasmons observed at the two resonance angles in the presence of the gold film clarifies the presence of the two narrow
lobes seen in the Fourier transform image of the hologram (Fig. 5.4b). Because the
probe is illuminated with linearly polarized light, surface plasmons are excited along
a preferred direction which results in the two lobes observed both in k-space and in
the reconstructed images in real space [17]. We also notice that due to the interference between the generated surface plasmons and the transmitted leaked radiation,
fringes in the gold film are observed in both the experimental and simulation results
(Fig. 5.9b, d) [26]. This behavior is also seen in the x–y intensity images presented
in Fig. 5.10 that show the two lobes of the surface plasmons excited by the incident
linear illumination [6, 17]. These results highly resemble the results obtained by
Drezet el al. [18] that are given in Fig. 5.10d.
5.3.3 Characterization of the Angular Scattering
From the results presented in the previous section, we can quantify the angular radiation patterns of the light scattered by the NSOM tip through different environments.
In the graphs of Fig. 5.11, we plot the normalized intensity of the scattered light as a