

124
N. Rahbany et al.
that the simulations give only a qualitative approximation of the EM field radiated
from the probes. This is due to two main reasons. First, this model can only be used
to accurately describe small radiation angles [41], and second, the subwavelength
details of the geometry of the metal-coated hollow probe and its interaction with two
plane metal/dielectric interfaces are not taken into account [42]. The latter interaction
can become important when the tip is coupled to a plasmonic sample [18, 20]. We
see from Fig. 5.7d that the simulation results are in good agreement with the experimental results. Note that this agreement is not achieved if the probe is modelled as
an electric or magnetic dipole only, which confirms the fact that such hollow probes
are best modelled as a superposition of perpendicular electric and magnetic dipoles.
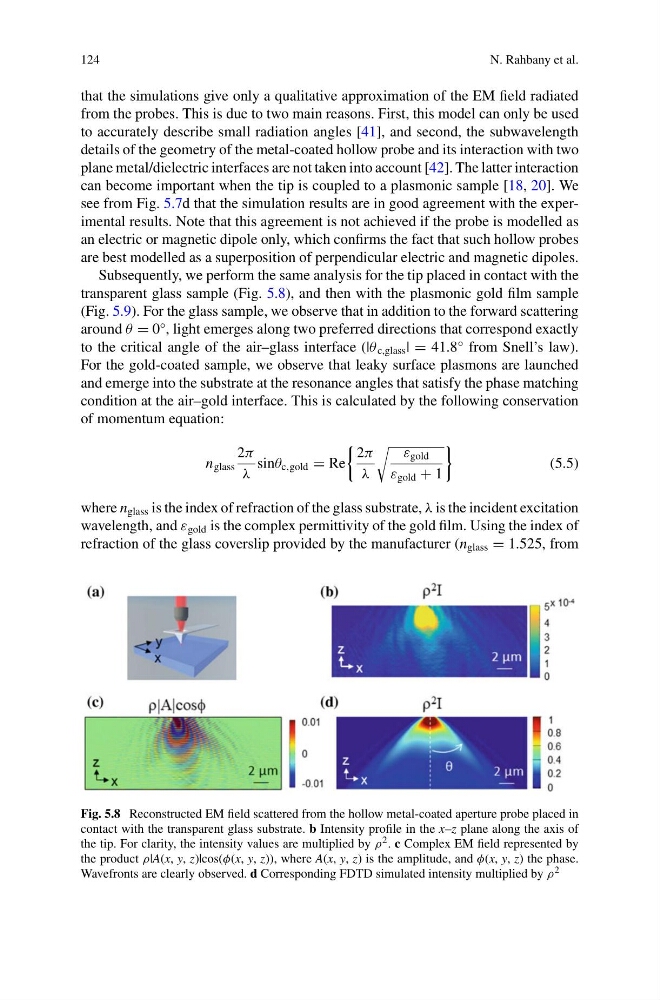
Subsequently, we perform the same analysis for the tip placed in contact with the
transparent glass sample (Fig. 5.8), and then with the plasmonic gold film sample
(Fig. 5.9). For the glass sample, we observe that in addition to the forward scattering
around θ = 0°, light emerges along two preferred directions that correspond exactly
to the critical angle of the air–glass interface (|θ c,glass | = 41.8° from Snell’s law).
For the gold-coated sample, we observe that leaky surface plasmons are launched
and emerge into the substrate at the resonance angles that satisfy the phase matching
condition at the air–gold interface. This is calculated by the following conservation
of momentum equation:
n glass
2π
λ
sinθ c,gold = Re
2π
λ
ε gold
ε gold + 1
(5.5)
where n glass is the index of refraction of the glass substrate, λ is the incident excitation
wavelength, and ε gold is the complex permittivity of the gold film. Using the index of
refraction of the glass coverslip provided by the manufacturer (n glass = 1.525, from
Fig. 5.8 Reconstructed EM field scattered from the hollow metal-coated aperture probe placed in
contact with the transparent glass substrate. b Intensity profile in the x–z plane along the axis of
the tip. For clarity, the intensity values are multiplied by ρ 2 . c Complex EM field represented by
the product ρ|A(x, y, z)|cos(φ(x, y, z)), where A(x, y, z) is the amplitude, and φ(x, y, z) the phase.
Wavefronts are clearly observed. d Corresponding FDTD simulated intensity multiplied by ρ 2
N. Rahbany et al.
that the simulations give only a qualitative approximation of the EM field radiated
from the probes. This is due to two main reasons. First, this model can only be used
to accurately describe small radiation angles [41], and second, the subwavelength
details of the geometry of the metal-coated hollow probe and its interaction with two
plane metal/dielectric interfaces are not taken into account [42]. The latter interaction
can become important when the tip is coupled to a plasmonic sample [18, 20]. We
see from Fig. 5.7d that the simulation results are in good agreement with the experimental results. Note that this agreement is not achieved if the probe is modelled as
an electric or magnetic dipole only, which confirms the fact that such hollow probes
are best modelled as a superposition of perpendicular electric and magnetic dipoles.
Subsequently, we perform the same analysis for the tip placed in contact with the
transparent glass sample (Fig. 5.8), and then with the plasmonic gold film sample
(Fig. 5.9). For the glass sample, we observe that in addition to the forward scattering
around θ = 0°, light emerges along two preferred directions that correspond exactly
to the critical angle of the air–glass interface (|θ c,glass | = 41.8° from Snell’s law).
For the gold-coated sample, we observe that leaky surface plasmons are launched
and emerge into the substrate at the resonance angles that satisfy the phase matching
condition at the air–gold interface. This is calculated by the following conservation
of momentum equation:
n glass
2π
λ
sinθ c,gold = Re
2π
λ
ε gold
ε gold + 1
(5.5)
where n glass is the index of refraction of the glass substrate, λ is the incident excitation
wavelength, and ε gold is the complex permittivity of the gold film. Using the index of
refraction of the glass coverslip provided by the manufacturer (n glass = 1.525, from
Fig. 5.8 Reconstructed EM field scattered from the hollow metal-coated aperture probe placed in
contact with the transparent glass substrate. b Intensity profile in the x–z plane along the axis of
the tip. For clarity, the intensity values are multiplied by ρ 2 . c Complex EM field represented by
the product ρ|A(x, y, z)|cos(φ(x, y, z)), where A(x, y, z) is the amplitude, and φ(x, y, z) the phase.
Wavefronts are clearly observed. d Corresponding FDTD simulated intensity multiplied by ρ 2