

126
N. Rahbany et al.
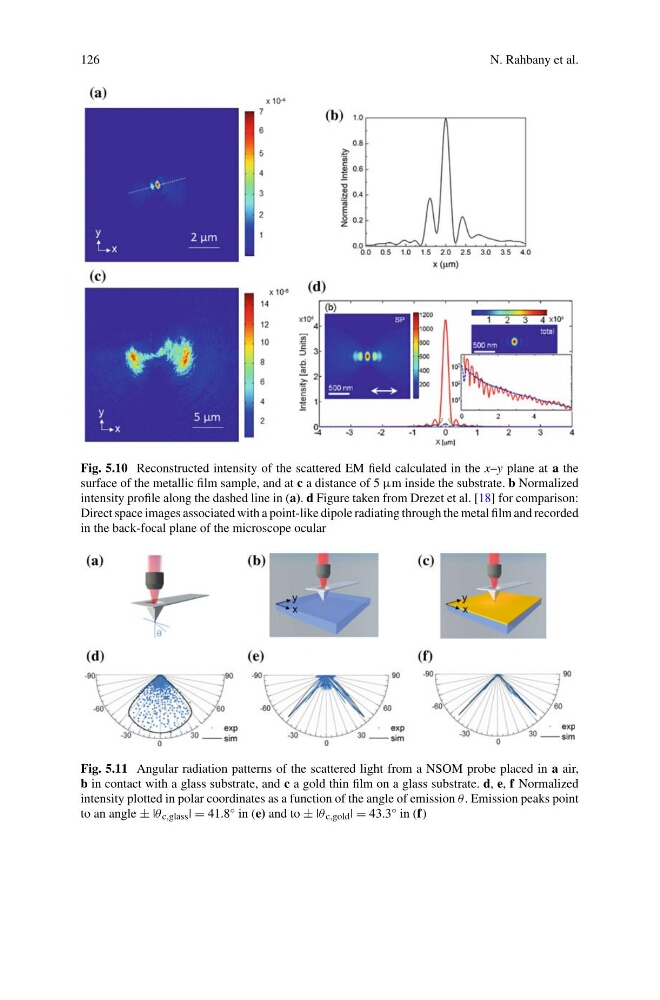
Fig. 5.10 Reconstructed intensity of the scattered EM field calculated in the x–y plane at a the
surface of the metallic film sample, and at c a distance of 5 μm inside the substrate. b Normalized
intensity profile along the dashed line in (a). d Figure taken from Drezet et al. [18] for comparison:
Direct space images associated with a point-like dipole radiating through the metal film and recorded
in the back-focal plane of the microscope ocular
Fig. 5.11 Angular radiation patterns of the scattered light from a NSOM probe placed in a air,
b in contact with a glass substrate, and c a gold thin film on a glass substrate. d, e, f Normalized
intensity plotted in polar coordinates as a function of the angle of emission θ. Emission peaks point
to an angle ± |θ c,glass | = 41.8° in (e) and to ± |θ c,gold | = 43.3° in (f)
N. Rahbany et al.
Fig. 5.10 Reconstructed intensity of the scattered EM field calculated in the x–y plane at a the
surface of the metallic film sample, and at c a distance of 5 μm inside the substrate. b Normalized
intensity profile along the dashed line in (a). d Figure taken from Drezet et al. [18] for comparison:
Direct space images associated with a point-like dipole radiating through the metal film and recorded
in the back-focal plane of the microscope ocular
Fig. 5.11 Angular radiation patterns of the scattered light from a NSOM probe placed in a air,
b in contact with a glass substrate, and c a gold thin film on a glass substrate. d, e, f Normalized
intensity plotted in polar coordinates as a function of the angle of emission θ. Emission peaks point
to an angle ± |θ c,glass | = 41.8° in (e) and to ± |θ c,gold | = 43.3° in (f)