

122
N. Rahbany et al.
20 μm
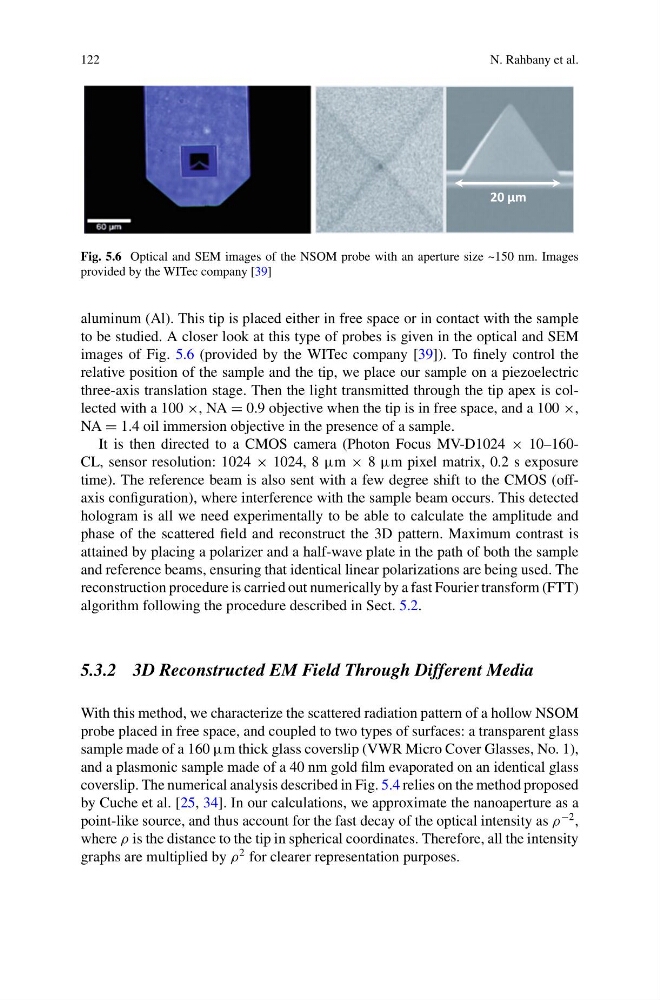
Fig. 5.6 Optical and SEM images of the NSOM probe with an aperture size ~150 nm. Images
provided by the WITec company [39]
aluminum (Al). This tip is placed either in free space or in contact with the sample
to be studied. A closer look at this type of probes is given in the optical and SEM
images of Fig. 5.6 (provided by the WITec company [39]). To finely control the
relative position of the sample and the tip, we place our sample on a piezoelectric
three-axis translation stage. Then the light transmitted through the tip apex is collected with a 100 ×, NA = 0.9 objective when the tip is in free space, and a 100 ×,
NA = 1.4 oil immersion objective in the presence of a sample.
It is then directed to a CMOS camera (Photon Focus MV-D1024 × 10–160CL, sensor resolution: 1024 × 1024, 8 μm × 8 μm pixel matrix, 0.2 s exposure
time). The reference beam is also sent with a few degree shift to the CMOS (offaxis configuration), where interference with the sample beam occurs. This detected
hologram is all we need experimentally to be able to calculate the amplitude and
phase of the scattered field and reconstruct the 3D pattern. Maximum contrast is
attained by placing a polarizer and a half-wave plate in the path of both the sample
and reference beams, ensuring that identical linear polarizations are being used. The
reconstruction procedure is carried out numerically by a fast Fourier transform (FTT)
algorithm following the procedure described in Sect. 5.2.
5.3.2 3D Reconstructed EM Field Through Different Media
With this method, we characterize the scattered radiation pattern of a hollow NSOM
probe placed in free space, and coupled to two types of surfaces: a transparent glass
sample made of a 160 μm thick glass coverslip (VWR Micro Cover Glasses, No. 1),
and a plasmonic sample made of a 40 nm gold film evaporated on an identical glass
coverslip. The numerical analysis described in Fig. 5.4 relies on the method proposed
by Cuche et al. [25, 34]. In our calculations, we approximate the nanoaperture as a
point-like source, and thus account for the fast decay of the optical intensity as ρ
−2 ,
where ρ is the distance to the tip in spherical coordinates. Therefore, all the intensity
graphs are multiplied by ρ
2 for clearer representation purposes.
N. Rahbany et al.
20 μm
Fig. 5.6 Optical and SEM images of the NSOM probe with an aperture size ~150 nm. Images
provided by the WITec company [39]
aluminum (Al). This tip is placed either in free space or in contact with the sample
to be studied. A closer look at this type of probes is given in the optical and SEM
images of Fig. 5.6 (provided by the WITec company [39]). To finely control the
relative position of the sample and the tip, we place our sample on a piezoelectric
three-axis translation stage. Then the light transmitted through the tip apex is collected with a 100 ×, NA = 0.9 objective when the tip is in free space, and a 100 ×,
NA = 1.4 oil immersion objective in the presence of a sample.
It is then directed to a CMOS camera (Photon Focus MV-D1024 × 10–160CL, sensor resolution: 1024 × 1024, 8 μm × 8 μm pixel matrix, 0.2 s exposure
time). The reference beam is also sent with a few degree shift to the CMOS (offaxis configuration), where interference with the sample beam occurs. This detected
hologram is all we need experimentally to be able to calculate the amplitude and
phase of the scattered field and reconstruct the 3D pattern. Maximum contrast is
attained by placing a polarizer and a half-wave plate in the path of both the sample
and reference beams, ensuring that identical linear polarizations are being used. The
reconstruction procedure is carried out numerically by a fast Fourier transform (FTT)
algorithm following the procedure described in Sect. 5.2.
5.3.2 3D Reconstructed EM Field Through Different Media
With this method, we characterize the scattered radiation pattern of a hollow NSOM
probe placed in free space, and coupled to two types of surfaces: a transparent glass
sample made of a 160 μm thick glass coverslip (VWR Micro Cover Glasses, No. 1),
and a plasmonic sample made of a 40 nm gold film evaporated on an identical glass
coverslip. The numerical analysis described in Fig. 5.4 relies on the method proposed
by Cuche et al. [25, 34]. In our calculations, we approximate the nanoaperture as a
point-like source, and thus account for the fast decay of the optical intensity as ρ
−2 ,
where ρ is the distance to the tip in spherical coordinates. Therefore, all the intensity
graphs are multiplied by ρ
2 for clearer representation purposes.