

4 Tomographic Diffractive Microscopy …
93
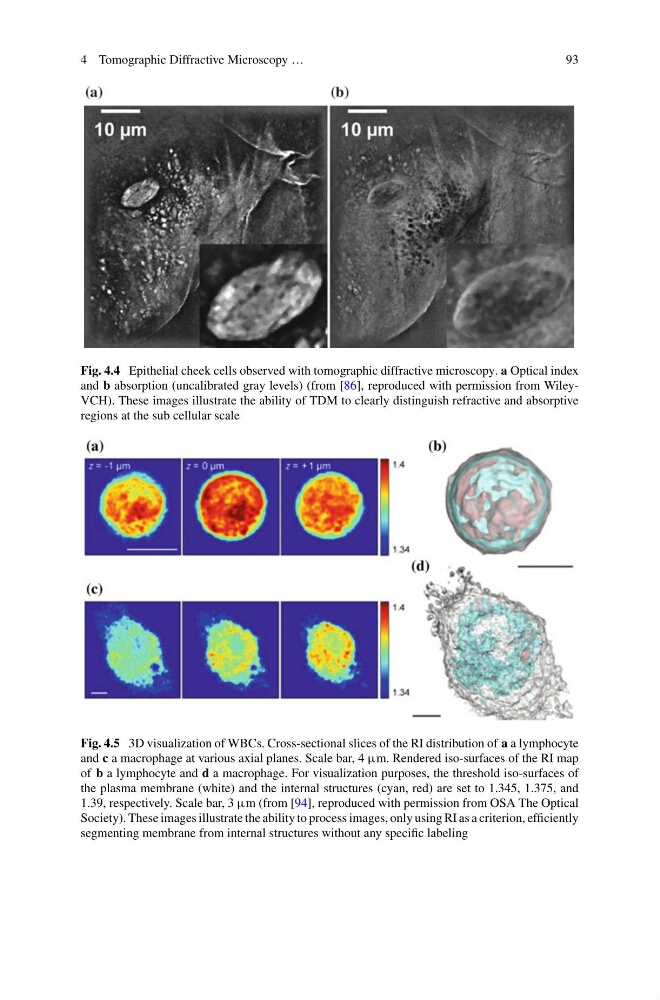
Fig. 4.4 Epithelial cheek cells observed with tomographic diffractive microscopy. a Optical index
and b absorption (uncalibrated gray levels) (from [86], reproduced with permission from WileyVCH). These images illustrate the ability of TDM to clearly distinguish refractive and absorptive
regions at the sub cellular scale
Fig. 4.5 3D visualization of WBCs. Cross-sectional slices of the RI distribution of a a lymphocyte
and c a macrophage at various axial planes. Scale bar, 4 μm. Rendered iso-surfaces of the RI map
of b a lymphocyte and d a macrophage. For visualization purposes, the threshold iso-surfaces of
the plasma membrane (white) and the internal structures (cyan, red) are set to 1.345, 1.375, and
1.39, respectively. Scale bar, 3 μm (from [94], reproduced with permission from OSA The Optical
Society). These images illustrate the ability to process images, only using RI as a criterion, efficiently
segmenting membrane from internal structures without any specific labeling
93
Fig. 4.4 Epithelial cheek cells observed with tomographic diffractive microscopy. a Optical index
and b absorption (uncalibrated gray levels) (from [86], reproduced with permission from WileyVCH). These images illustrate the ability of TDM to clearly distinguish refractive and absorptive
regions at the sub cellular scale
Fig. 4.5 3D visualization of WBCs. Cross-sectional slices of the RI distribution of a a lymphocyte
and c a macrophage at various axial planes. Scale bar, 4 μm. Rendered iso-surfaces of the RI map
of b a lymphocyte and d a macrophage. For visualization purposes, the threshold iso-surfaces of
the plasma membrane (white) and the internal structures (cyan, red) are set to 1.345, 1.375, and
1.39, respectively. Scale bar, 3 μm (from [94], reproduced with permission from OSA The Optical
Society). These images illustrate the ability to process images, only using RI as a criterion, efficiently
segmenting membrane from internal structures without any specific labeling