

8 Dynamics of Cerebrospinal Fluid: From Theoretical Models to Clinical Applications
207
Third ventricle
CSF inflow
Third ventricle
CSF outflow
CSF FLOW
during one cardiac cycle
(mm/sec)
Cardiac phases
volunteers (aqueduc)
600
400
200
-200
-400
-600
-800
0
Post-op (V3)
Post-op + 1 year (V3)
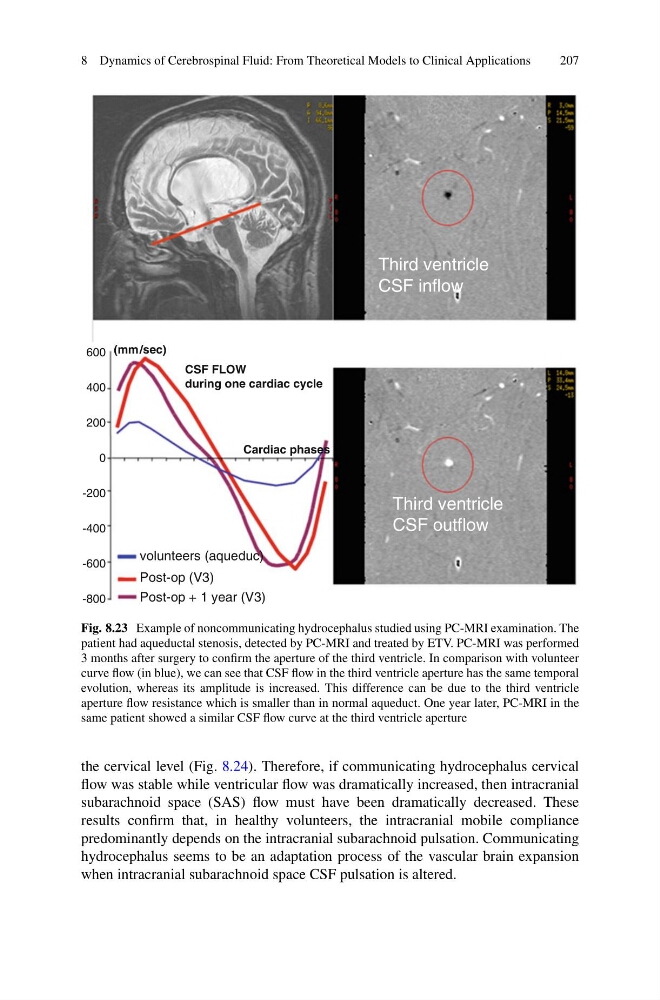
Fig. 8.23 Example of noncommunicating hydrocephalus studied using PC-MRI examination. The
patient had aqueductal stenosis, detected by PC-MRI and treated by ETV. PC-MRI was performed
3 months after surgery to confirm the aperture of the third ventricle. In comparison with volunteer
curve flow (in blue), we can see that CSF flow in the third ventricle aperture has the same temporal
evolution, whereas its amplitude is increased. This difference can be due to the third ventricle
aperture flow resistance which is smaller than in normal aqueduct. One year later, PC-MRI in the
same patient showed a similar CSF flow curve at the third ventricle aperture
the cervical level (Fig. 8.24). Therefore, if communicating hydrocephalus cervical
flow was stable while ventricular flow was dramatically increased, then intracranial
subarachnoid space (SAS) flow must have been dramatically decreased. These
results confirm that, in healthy volunteers, the intracranial mobile compliance
predominantly depends on the intracranial subarachnoid pulsation. Communicating
hydrocephalus seems to be an adaptation process of the vascular brain expansion
when intracranial subarachnoid space CSF pulsation is altered.
207
Third ventricle
CSF inflow
Third ventricle
CSF outflow
CSF FLOW
during one cardiac cycle
(mm/sec)
Cardiac phases
volunteers (aqueduc)
600
400
200
-200
-400
-600
-800
0
Post-op (V3)
Post-op + 1 year (V3)
Fig. 8.23 Example of noncommunicating hydrocephalus studied using PC-MRI examination. The
patient had aqueductal stenosis, detected by PC-MRI and treated by ETV. PC-MRI was performed
3 months after surgery to confirm the aperture of the third ventricle. In comparison with volunteer
curve flow (in blue), we can see that CSF flow in the third ventricle aperture has the same temporal
evolution, whereas its amplitude is increased. This difference can be due to the third ventricle
aperture flow resistance which is smaller than in normal aqueduct. One year later, PC-MRI in the
same patient showed a similar CSF flow curve at the third ventricle aperture
the cervical level (Fig. 8.24). Therefore, if communicating hydrocephalus cervical
flow was stable while ventricular flow was dramatically increased, then intracranial
subarachnoid space (SAS) flow must have been dramatically decreased. These
results confirm that, in healthy volunteers, the intracranial mobile compliance
predominantly depends on the intracranial subarachnoid pulsation. Communicating
hydrocephalus seems to be an adaptation process of the vascular brain expansion
when intracranial subarachnoid space CSF pulsation is altered.