

198
L. Geregele et al.
mm3/s
2000
1000
0
-1000
-2000
-3000
-4000
-5000
-6000
0 10 20 30 40 50 60 70 80 90
10 20 30 40 50 60 70 80 90 100
%
% of cardiac cycle
mm
3 /sec
R-R
Cerebral
output flow
Global (CSF+blood) cerebral flow
during two cardiac cycles
Cerebral
input flow
0
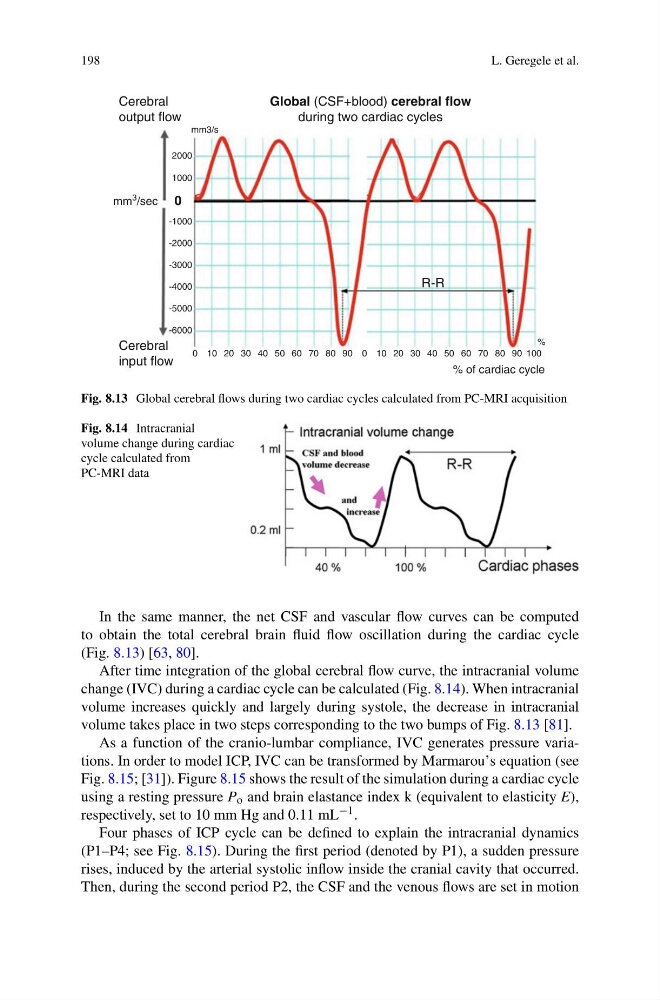
Fig. 8.13 Global cerebral flows during two cardiac cycles calculated from PC-MRI acquisition
Fig. 8.14 Intracranial
volume change during cardiac
cycle calculated from
PC-MRI data
In the same manner, the net CSF and vascular flow curves can be computed
to obtain the total cerebral brain fluid flow oscillation during the cardiac cycle
(Fig. 8.13) [63, 80].
After time integration of the global cerebral flow curve, the intracranial volume
change (IVC) during a cardiac cycle can be calculated (Fig. 8.14). When intracranial
volume increases quickly and largely during systole, the decrease in intracranial
volume takes place in two steps corresponding to the two bumps of Fig. 8.13 [81].
As a function of the cranio-lumbar compliance, IVC generates pressure variations. In order to model ICP, IVC can be transformed by Marmarou’s equation (see
Fig. 8.15; [31]). Figure 8.15 shows the result of the simulation during a cardiac cycle
using a resting pressure P o and brain elastance index k (equivalent to elasticity E),
respectively, set to 10 mm Hg and 0.11 mL −1 .
Four phases of ICP cycle can be defined to explain the intracranial dynamics
(P1–P4; see Fig. 8.15). During the first period (denoted by P1), a sudden pressure
rises, induced by the arterial systolic inflow inside the cranial cavity that occurred.
Then, during the second period P2, the CSF and the venous flows are set in motion
L. Geregele et al.
mm3/s
2000
1000
0
-1000
-2000
-3000
-4000
-5000
-6000
0 10 20 30 40 50 60 70 80 90
10 20 30 40 50 60 70 80 90 100
%
% of cardiac cycle
mm
3 /sec
R-R
Cerebral
output flow
Global (CSF+blood) cerebral flow
during two cardiac cycles
Cerebral
input flow
0
Fig. 8.13 Global cerebral flows during two cardiac cycles calculated from PC-MRI acquisition
Fig. 8.14 Intracranial
volume change during cardiac
cycle calculated from
PC-MRI data
In the same manner, the net CSF and vascular flow curves can be computed
to obtain the total cerebral brain fluid flow oscillation during the cardiac cycle
(Fig. 8.13) [63, 80].
After time integration of the global cerebral flow curve, the intracranial volume
change (IVC) during a cardiac cycle can be calculated (Fig. 8.14). When intracranial
volume increases quickly and largely during systole, the decrease in intracranial
volume takes place in two steps corresponding to the two bumps of Fig. 8.13 [81].
As a function of the cranio-lumbar compliance, IVC generates pressure variations. In order to model ICP, IVC can be transformed by Marmarou’s equation (see
Fig. 8.15; [31]). Figure 8.15 shows the result of the simulation during a cardiac cycle
using a resting pressure P o and brain elastance index k (equivalent to elasticity E),
respectively, set to 10 mm Hg and 0.11 mL −1 .
Four phases of ICP cycle can be defined to explain the intracranial dynamics
(P1–P4; see Fig. 8.15). During the first period (denoted by P1), a sudden pressure
rises, induced by the arterial systolic inflow inside the cranial cavity that occurred.
Then, during the second period P2, the CSF and the venous flows are set in motion