

196
L. Geregele et al.
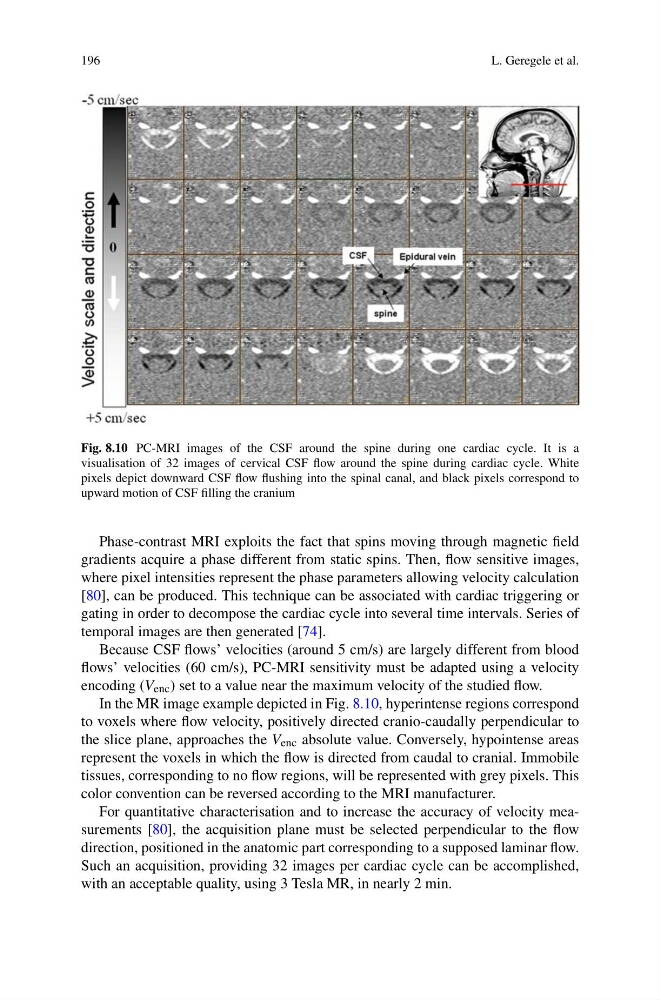
Fig. 8.10 PC-MRI images of the CSF around the spine during one cardiac cycle. It is a
visualisation of 32 images of cervical CSF flow around the spine during cardiac cycle. White
pixels depict downward CSF flow flushing into the spinal canal, and black pixels correspond to
upward motion of CSF filling the cranium
Phase-contrast MRI exploits the fact that spins moving through magnetic field
gradients acquire a phase different from static spins. Then, flow sensitive images,
where pixel intensities represent the phase parameters allowing velocity calculation
[80], can be produced. This technique can be associated with cardiac triggering or
gating in order to decompose the cardiac cycle into several time intervals. Series of
temporal images are then generated [74].
Because CSF flows’ velocities (around 5 cm/s) are largely different from blood
flows’ velocities (60 cm/s), PC-MRI sensitivity must be adapted using a velocity
encoding (V enc ) set to a value near the maximum velocity of the studied flow.
In the MR image example depicted in Fig. 8.10, hyperintense regions correspond
to voxels where flow velocity, positively directed cranio-caudally perpendicular to
the slice plane, approaches the V enc absolute value. Conversely, hypointense areas
represent the voxels in which the flow is directed from caudal to cranial. Immobile
tissues, corresponding to no flow regions, will be represented with grey pixels. This
color convention can be reversed according to the MRI manufacturer.
For quantitative characterisation and to increase the accuracy of velocity measurements [80], the acquisition plane must be selected perpendicular to the flow
direction, positioned in the anatomic part corresponding to a supposed laminar flow.
Such an acquisition, providing 32 images per cardiac cycle can be accomplished,
with an acceptable quality, using 3 Tesla MR, in nearly 2 min.
L. Geregele et al.
Fig. 8.10 PC-MRI images of the CSF around the spine during one cardiac cycle. It is a
visualisation of 32 images of cervical CSF flow around the spine during cardiac cycle. White
pixels depict downward CSF flow flushing into the spinal canal, and black pixels correspond to
upward motion of CSF filling the cranium
Phase-contrast MRI exploits the fact that spins moving through magnetic field
gradients acquire a phase different from static spins. Then, flow sensitive images,
where pixel intensities represent the phase parameters allowing velocity calculation
[80], can be produced. This technique can be associated with cardiac triggering or
gating in order to decompose the cardiac cycle into several time intervals. Series of
temporal images are then generated [74].
Because CSF flows’ velocities (around 5 cm/s) are largely different from blood
flows’ velocities (60 cm/s), PC-MRI sensitivity must be adapted using a velocity
encoding (V enc ) set to a value near the maximum velocity of the studied flow.
In the MR image example depicted in Fig. 8.10, hyperintense regions correspond
to voxels where flow velocity, positively directed cranio-caudally perpendicular to
the slice plane, approaches the V enc absolute value. Conversely, hypointense areas
represent the voxels in which the flow is directed from caudal to cranial. Immobile
tissues, corresponding to no flow regions, will be represented with grey pixels. This
color convention can be reversed according to the MRI manufacturer.
For quantitative characterisation and to increase the accuracy of velocity measurements [80], the acquisition plane must be selected perpendicular to the flow
direction, positioned in the anatomic part corresponding to a supposed laminar flow.
Such an acquisition, providing 32 images per cardiac cycle can be accomplished,
with an acceptable quality, using 3 Tesla MR, in nearly 2 min.