

44
D.-W. Kim and C.-H. Im
X [m, k]
+∞
n−∞
x[n]w[n − m]e
−j2πkn/N
.
(3.12)
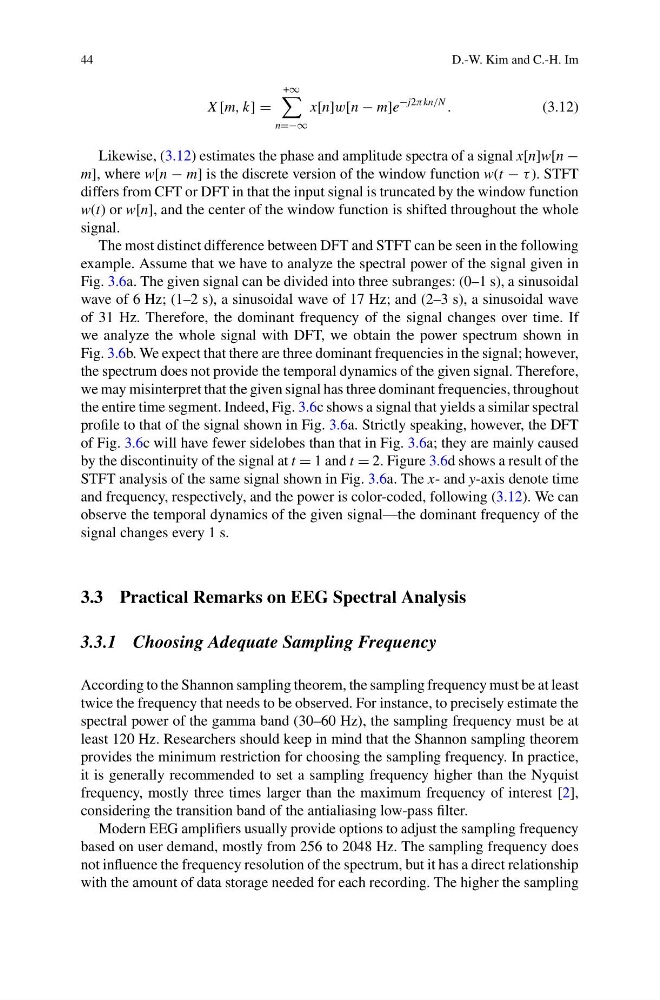
Likewise, (3.12) estimates the phase and amplitude spectra of a signal x[n]w[n −
m], where w[n − m] is the discrete version of the window function w(t − τ ). STFT
differs from CFT or DFT in that the input signal is truncated by the window function
w(t) or w[n], and the center of the window function is shifted throughout the whole
signal.
The most distinct difference between DFT and STFT can be seen in the following
example. Assume that we have to analyze the spectral power of the signal given in
Fig. 3.6a. The given signal can be divided into three subranges: (0–1 s), a sinusoidal
wave of 6 Hz; (1–2 s), a sinusoidal wave of 17 Hz; and (2–3 s), a sinusoidal wave
of 31 Hz. Therefore, the dominant frequency of the signal changes over time. If
we analyze the whole signal with DFT, we obtain the power spectrum shown in
Fig. 3.6b. We expect that there are three dominant frequencies in the signal; however,
the spectrum does not provide the temporal dynamics of the given signal. Therefore,
we may misinterpret that the given signal has three dominant frequencies, throughout
the entire time segment. Indeed, Fig. 3.6c shows a signal that yields a similar spectral
profile to that of the signal shown in Fig. 3.6a. Strictly speaking, however, the DFT
of Fig. 3.6c will have fewer sidelobes than that in Fig. 3.6a; they are mainly caused
by the discontinuity of the signal at t 1 and t 2. Figure 3.6d shows a result of the
STFT analysis of the same signal shown in Fig. 3.6a. The x- and y-axis denote time
and frequency, respectively, and the power is color-coded, following (3.12). We can
observe the temporal dynamics of the given signal—the dominant frequency of the
signal changes every 1 s.
3.3 Practical Remarks on EEG Spectral Analysis
3.3.1 Choosing Adequate Sampling Frequency
According to the Shannon sampling theorem, the sampling frequency must be at least
twice the frequency that needs to be observed. For instance, to precisely estimate the
spectral power of the gamma band (30–60 Hz), the sampling frequency must be at
least 120 Hz. Researchers should keep in mind that the Shannon sampling theorem
provides the minimum restriction for choosing the sampling frequency. In practice,
it is generally recommended to set a sampling frequency higher than the Nyquist
frequency, mostly three times larger than the maximum frequency of interest [2],
considering the transition band of the antialiasing low-pass filter.
Modern EEG amplifiers usually provide options to adjust the sampling frequency
based on user demand, mostly from 256 to 2048 Hz. The sampling frequency does
not influence the frequency resolution of the spectrum, but it has a direct relationship
with the amount of data storage needed for each recording. The higher the sampling
D.-W. Kim and C.-H. Im
X [m, k]
+∞
n−∞
x[n]w[n − m]e
−j2πkn/N
.
(3.12)
Likewise, (3.12) estimates the phase and amplitude spectra of a signal x[n]w[n −
m], where w[n − m] is the discrete version of the window function w(t − τ ). STFT
differs from CFT or DFT in that the input signal is truncated by the window function
w(t) or w[n], and the center of the window function is shifted throughout the whole
signal.
The most distinct difference between DFT and STFT can be seen in the following
example. Assume that we have to analyze the spectral power of the signal given in
Fig. 3.6a. The given signal can be divided into three subranges: (0–1 s), a sinusoidal
wave of 6 Hz; (1–2 s), a sinusoidal wave of 17 Hz; and (2–3 s), a sinusoidal wave
of 31 Hz. Therefore, the dominant frequency of the signal changes over time. If
we analyze the whole signal with DFT, we obtain the power spectrum shown in
Fig. 3.6b. We expect that there are three dominant frequencies in the signal; however,
the spectrum does not provide the temporal dynamics of the given signal. Therefore,
we may misinterpret that the given signal has three dominant frequencies, throughout
the entire time segment. Indeed, Fig. 3.6c shows a signal that yields a similar spectral
profile to that of the signal shown in Fig. 3.6a. Strictly speaking, however, the DFT
of Fig. 3.6c will have fewer sidelobes than that in Fig. 3.6a; they are mainly caused
by the discontinuity of the signal at t 1 and t 2. Figure 3.6d shows a result of the
STFT analysis of the same signal shown in Fig. 3.6a. The x- and y-axis denote time
and frequency, respectively, and the power is color-coded, following (3.12). We can
observe the temporal dynamics of the given signal—the dominant frequency of the
signal changes every 1 s.
3.3 Practical Remarks on EEG Spectral Analysis
3.3.1 Choosing Adequate Sampling Frequency
According to the Shannon sampling theorem, the sampling frequency must be at least
twice the frequency that needs to be observed. For instance, to precisely estimate the
spectral power of the gamma band (30–60 Hz), the sampling frequency must be at
least 120 Hz. Researchers should keep in mind that the Shannon sampling theorem
provides the minimum restriction for choosing the sampling frequency. In practice,
it is generally recommended to set a sampling frequency higher than the Nyquist
frequency, mostly three times larger than the maximum frequency of interest [2],
considering the transition band of the antialiasing low-pass filter.
Modern EEG amplifiers usually provide options to adjust the sampling frequency
based on user demand, mostly from 256 to 2048 Hz. The sampling frequency does
not influence the frequency resolution of the spectrum, but it has a direct relationship
with the amount of data storage needed for each recording. The higher the sampling