

3 EEG Spectral Analysis
45
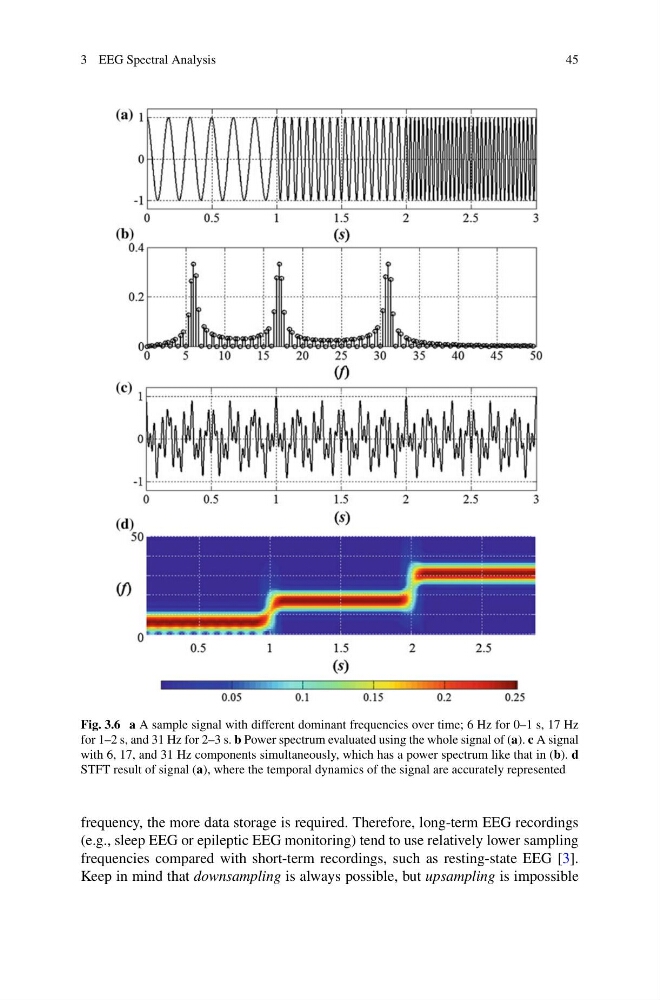
Fig. 3.6 a A sample signal with different dominant frequencies over time; 6 Hz for 0–1 s, 17 Hz
for 1–2 s, and 31 Hz for 2–3 s. b Power spectrum evaluated using the whole signal of (a). c A signal
with 6, 17, and 31 Hz components simultaneously, which has a power spectrum like that in (b). d
STFT result of signal (a), where the temporal dynamics of the signal are accurately represented
frequency, the more data storage is required. Therefore, long-term EEG recordings
(e.g., sleep EEG or epileptic EEG monitoring) tend to use relatively lower sampling
frequencies compared with short-term recordings, such as resting-state EEG [3].
Keep in mind that downsampling is always possible, but upsampling is impossible
45
Fig. 3.6 a A sample signal with different dominant frequencies over time; 6 Hz for 0–1 s, 17 Hz
for 1–2 s, and 31 Hz for 2–3 s. b Power spectrum evaluated using the whole signal of (a). c A signal
with 6, 17, and 31 Hz components simultaneously, which has a power spectrum like that in (b). d
STFT result of signal (a), where the temporal dynamics of the signal are accurately represented
frequency, the more data storage is required. Therefore, long-term EEG recordings
(e.g., sleep EEG or epileptic EEG monitoring) tend to use relatively lower sampling
frequencies compared with short-term recordings, such as resting-state EEG [3].
Keep in mind that downsampling is always possible, but upsampling is impossible