

38
D.-W. Kim and C.-H. Im
including locations of a reference electrode and recording electrodes, preprocessing methods, and some necessary methodological parameters, such as epoch length,
types of windowing functions, and frequency resolution. What makes it worse is
that a large number of studies often fail to report key factors or parameters, making
new researchers in this field arbitrarily guess the factors/parameters or use default
values provided by analysis software without any concrete background knowledge.
Therefore, in this chapter, we cover not only the basic methodological background
of EEG spectral analysis but also a number of crucial concepts and factors that one
needs to be aware of before and during performing EEG spectral analysis.
3.2 Methodological Background
3.2.1 Continuous Fourier Transform
Fourier transform is a straightforward method to calculate the power spectrum of a
signal. In this chapter, we cover only the basic properties of the Fourier transform,
beginning with how it can estimate the power of a certain frequency in the signal.
Detailed derivation of each equation can be found in signal-processing textbooks [30,
34]. First, we start with the general case of a continuous nonperiodic signal. Assume
x(t) as a signal that is infinite in length and continuous in time. The continuous
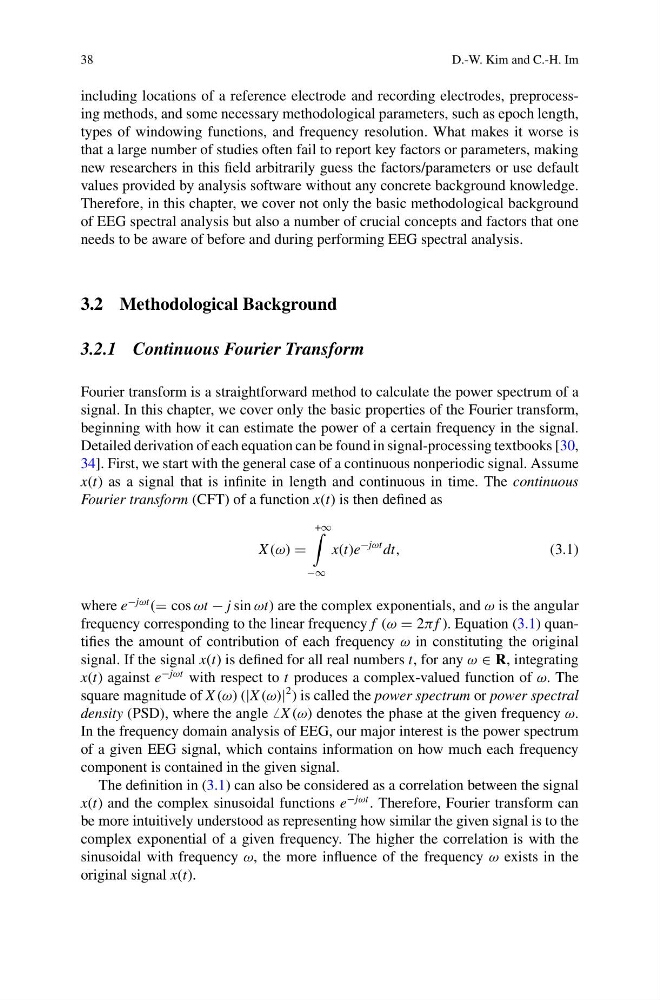
Fourier transform (CFT) of a function x(t) is then defined as
X (ω)
+∞
−∞
x(t)e
−jωt dt,
(3.1)
where e
−jωt ( cos ωt − j sin ωt) are the complex exponentials, and ω is the angular
frequency corresponding to the linear frequency f (ω 2π f ). Equation (3.1) quantifies the amount of contribution of each frequency ω in constituting the original
signal. If the signal x(t) is defined for all real numbers t, for any ω ∈ R, integrating
x(t) against e
−jωt with respect to t produces a complex-valued function of ω. The
square magnitude of X (ω) (|X (ω)|
2 ) is called the power spectrum or power spectral
density (PSD), where the angle X (ω) denotes the phase at the given frequency ω.
In the frequency domain analysis of EEG, our major interest is the power spectrum
of a given EEG signal, which contains information on how much each frequency
component is contained in the given signal.
The definition in (3.1) can also be considered as a correlation between the signal
x(t) and the complex sinusoidal functions e
−jωt . Therefore, Fourier transform can
be more intuitively understood as representing how similar the given signal is to the
complex exponential of a given frequency. The higher the correlation is with the
sinusoidal with frequency ω, the more influence of the frequency ω exists in the
original signal x(t).
D.-W. Kim and C.-H. Im
including locations of a reference electrode and recording electrodes, preprocessing methods, and some necessary methodological parameters, such as epoch length,
types of windowing functions, and frequency resolution. What makes it worse is
that a large number of studies often fail to report key factors or parameters, making
new researchers in this field arbitrarily guess the factors/parameters or use default
values provided by analysis software without any concrete background knowledge.
Therefore, in this chapter, we cover not only the basic methodological background
of EEG spectral analysis but also a number of crucial concepts and factors that one
needs to be aware of before and during performing EEG spectral analysis.
3.2 Methodological Background
3.2.1 Continuous Fourier Transform
Fourier transform is a straightforward method to calculate the power spectrum of a
signal. In this chapter, we cover only the basic properties of the Fourier transform,
beginning with how it can estimate the power of a certain frequency in the signal.
Detailed derivation of each equation can be found in signal-processing textbooks [30,
34]. First, we start with the general case of a continuous nonperiodic signal. Assume
x(t) as a signal that is infinite in length and continuous in time. The continuous
Fourier transform (CFT) of a function x(t) is then defined as
X (ω)
+∞
−∞
x(t)e
−jωt dt,
(3.1)
where e
−jωt ( cos ωt − j sin ωt) are the complex exponentials, and ω is the angular
frequency corresponding to the linear frequency f (ω 2π f ). Equation (3.1) quantifies the amount of contribution of each frequency ω in constituting the original
signal. If the signal x(t) is defined for all real numbers t, for any ω ∈ R, integrating
x(t) against e
−jωt with respect to t produces a complex-valued function of ω. The
square magnitude of X (ω) (|X (ω)|
2 ) is called the power spectrum or power spectral
density (PSD), where the angle X (ω) denotes the phase at the given frequency ω.
In the frequency domain analysis of EEG, our major interest is the power spectrum
of a given EEG signal, which contains information on how much each frequency
component is contained in the given signal.
The definition in (3.1) can also be considered as a correlation between the signal
x(t) and the complex sinusoidal functions e
−jωt . Therefore, Fourier transform can
be more intuitively understood as representing how similar the given signal is to the
complex exponential of a given frequency. The higher the correlation is with the
sinusoidal with frequency ω, the more influence of the frequency ω exists in the
original signal x(t).