

3 EEG Spectral Analysis
37
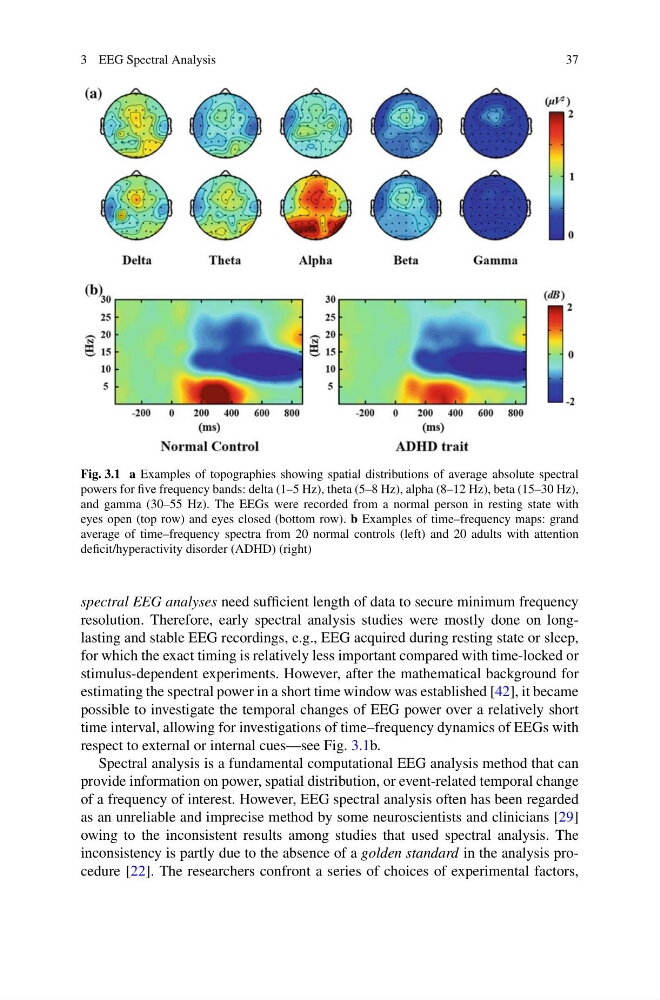
Fig. 3.1 a Examples of topographies showing spatial distributions of average absolute spectral
powers for five frequency bands: delta (1–5 Hz), theta (5–8 Hz), alpha (8–12 Hz), beta (15–30 Hz),
and gamma (30–55 Hz). The EEGs were recorded from a normal person in resting state with
eyes open (top row) and eyes closed (bottom row). b Examples of time–frequency maps: grand
average of time–frequency spectra from 20 normal controls (left) and 20 adults with attention
deficit/hyperactivity disorder (ADHD) (right)
spectral EEG analyses need sufficient length of data to secure minimum frequency
resolution. Therefore, early spectral analysis studies were mostly done on longlasting and stable EEG recordings, e.g., EEG acquired during resting state or sleep,
for which the exact timing is relatively less important compared with time-locked or
stimulus-dependent experiments. However, after the mathematical background for
estimating the spectral power in a short time window was established [42], it became
possible to investigate the temporal changes of EEG power over a relatively short
time interval, allowing for investigations of time–frequency dynamics of EEGs with
respect to external or internal cues—see Fig. 3.1b.
Spectral analysis is a fundamental computational EEG analysis method that can
provide information on power, spatial distribution, or event-related temporal change
of a frequency of interest. However, EEG spectral analysis often has been regarded
as an unreliable and imprecise method by some neuroscientists and clinicians [29]
owing to the inconsistent results among studies that used spectral analysis. The
inconsistency is partly due to the absence of a golden standard in the analysis procedure [22]. The researchers confront a series of choices of experimental factors,
37
Fig. 3.1 a Examples of topographies showing spatial distributions of average absolute spectral
powers for five frequency bands: delta (1–5 Hz), theta (5–8 Hz), alpha (8–12 Hz), beta (15–30 Hz),
and gamma (30–55 Hz). The EEGs were recorded from a normal person in resting state with
eyes open (top row) and eyes closed (bottom row). b Examples of time–frequency maps: grand
average of time–frequency spectra from 20 normal controls (left) and 20 adults with attention
deficit/hyperactivity disorder (ADHD) (right)
spectral EEG analyses need sufficient length of data to secure minimum frequency
resolution. Therefore, early spectral analysis studies were mostly done on longlasting and stable EEG recordings, e.g., EEG acquired during resting state or sleep,
for which the exact timing is relatively less important compared with time-locked or
stimulus-dependent experiments. However, after the mathematical background for
estimating the spectral power in a short time window was established [42], it became
possible to investigate the temporal changes of EEG power over a relatively short
time interval, allowing for investigations of time–frequency dynamics of EEGs with
respect to external or internal cues—see Fig. 3.1b.
Spectral analysis is a fundamental computational EEG analysis method that can
provide information on power, spatial distribution, or event-related temporal change
of a frequency of interest. However, EEG spectral analysis often has been regarded
as an unreliable and imprecise method by some neuroscientists and clinicians [29]
owing to the inconsistent results among studies that used spectral analysis. The
inconsistency is partly due to the absence of a golden standard in the analysis procedure [22]. The researchers confront a series of choices of experimental factors,