

202
G. D. Johnson and D. J. Krusienski
-450 -400 -350 -300 -250 -200 -150 -100 -50
0
Time (ms)
-10
-8
-6
-4
-2
0
2
4
6
8
10
Amplitude (uV)
EEG Signal Segment
Original Signal
Hanning-windowed Signal
Scaled Hanning Envelope
0
5
10
15
20
25
30
35
40
Frequency (Hz)
0
0.5
1
1.5
2
Magnitude
Magnitude Spectra
FFT
FFT-Hanning Window
AR-5
AR-10
AR-20
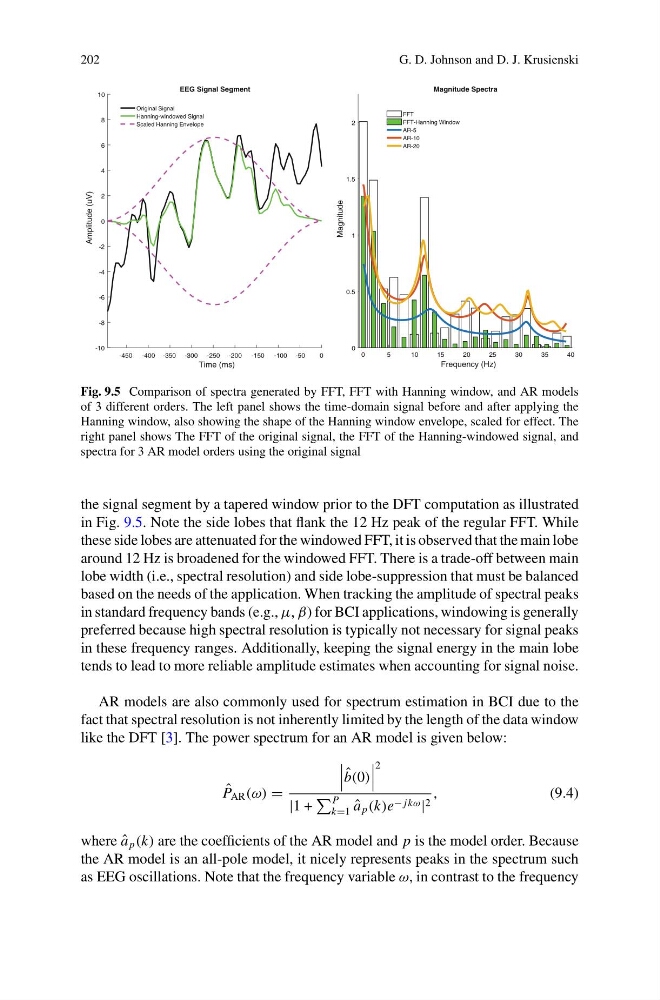
Fig. 9.5 Comparison of spectra generated by FFT, FFT with Hanning window, and AR models
of 3 different orders. The left panel shows the time-domain signal before and after applying the
Hanning window, also showing the shape of the Hanning window envelope, scaled for effect. The
right panel shows The FFT of the original signal, the FFT of the Hanning-windowed signal, and
spectra for 3 AR model orders using the original signal
the signal segment by a tapered window prior to the DFT computation as illustrated
in Fig. 9.5. Note the side lobes that flank the 12 Hz peak of the regular FFT. While
these side lobes are attenuated for the windowed FFT, it is observed that the main lobe
around 12 Hz is broadened for the windowed FFT. There is a trade-off between main
lobe width (i.e., spectral resolution) and side lobe-suppression that must be balanced
based on the needs of the application. When tracking the amplitude of spectral peaks
in standard frequency bands (e.g., μ, β) for BCI applications, windowing is generally
preferred because high spectral resolution is typically not necessary for signal peaks
in these frequency ranges. Additionally, keeping the signal energy in the main lobe
tends to lead to more reliable amplitude estimates when accounting for signal noise.
AR models are also commonly used for spectrum estimation in BCI due to the
fact that spectral resolution is not inherently limited by the length of the data window
like the DFT [3]. The power spectrum for an AR model is given below:
ˆ
P AR (ω)
ˆ
b(0)
2
|1 +
P
k1 ˆ
a p (k)e − jkω | 2
,
(9.4)
where ˆ
a p (k) are the coefficients of the AR model and p is the model order. Because
the AR model is an all-pole model, it nicely represents peaks in the spectrum such
as EEG oscillations. Note that the frequency variable ω, in contrast to the frequency
G. D. Johnson and D. J. Krusienski
-450 -400 -350 -300 -250 -200 -150 -100 -50
0
Time (ms)
-10
-8
-6
-4
-2
0
2
4
6
8
10
Amplitude (uV)
EEG Signal Segment
Original Signal
Hanning-windowed Signal
Scaled Hanning Envelope
0
5
10
15
20
25
30
35
40
Frequency (Hz)
0
0.5
1
1.5
2
Magnitude
Magnitude Spectra
FFT
FFT-Hanning Window
AR-5
AR-10
AR-20
Fig. 9.5 Comparison of spectra generated by FFT, FFT with Hanning window, and AR models
of 3 different orders. The left panel shows the time-domain signal before and after applying the
Hanning window, also showing the shape of the Hanning window envelope, scaled for effect. The
right panel shows The FFT of the original signal, the FFT of the Hanning-windowed signal, and
spectra for 3 AR model orders using the original signal
the signal segment by a tapered window prior to the DFT computation as illustrated
in Fig. 9.5. Note the side lobes that flank the 12 Hz peak of the regular FFT. While
these side lobes are attenuated for the windowed FFT, it is observed that the main lobe
around 12 Hz is broadened for the windowed FFT. There is a trade-off between main
lobe width (i.e., spectral resolution) and side lobe-suppression that must be balanced
based on the needs of the application. When tracking the amplitude of spectral peaks
in standard frequency bands (e.g., μ, β) for BCI applications, windowing is generally
preferred because high spectral resolution is typically not necessary for signal peaks
in these frequency ranges. Additionally, keeping the signal energy in the main lobe
tends to lead to more reliable amplitude estimates when accounting for signal noise.
AR models are also commonly used for spectrum estimation in BCI due to the
fact that spectral resolution is not inherently limited by the length of the data window
like the DFT [3]. The power spectrum for an AR model is given below:
ˆ
P AR (ω)
ˆ
b(0)
2
|1 +
P
k1 ˆ
a p (k)e − jkω | 2
,
(9.4)
where ˆ
a p (k) are the coefficients of the AR model and p is the model order. Because
the AR model is an all-pole model, it nicely represents peaks in the spectrum such
as EEG oscillations. Note that the frequency variable ω, in contrast to the frequency