

9 Computational EEG Analysis for Brain-Computer Interfaces
201
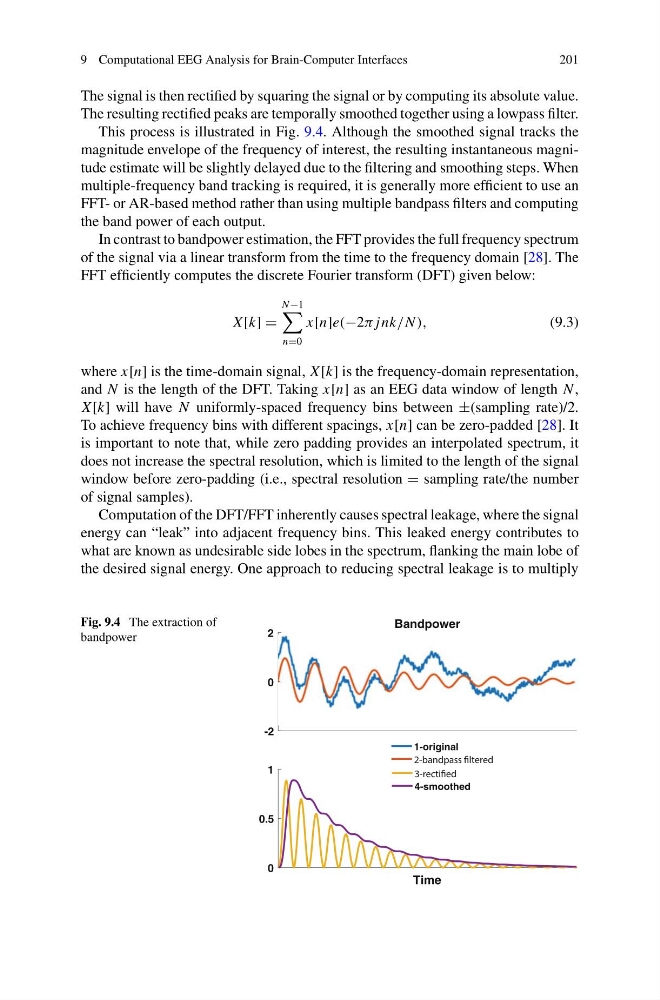
The signal is then rectified by squaring the signal or by computing its absolute value.
The resulting rectified peaks are temporally smoothed together using a lowpass filter.
This process is illustrated in Fig. 9.4. Although the smoothed signal tracks the
magnitude envelope of the frequency of interest, the resulting instantaneous magnitude estimate will be slightly delayed due to the filtering and smoothing steps. When
multiple-frequency band tracking is required, it is generally more efficient to use an
FFT- or AR-based method rather than using multiple bandpass filters and computing
the band power of each output.
In contrast to bandpower estimation, the FFT provides the full frequency spectrum
of the signal via a linear transform from the time to the frequency domain [28]. The
FFT efficiently computes the discrete Fourier transform (DFT) given below:
X [k]
N −1
n0
x[n]e(−2π jnk/N ),
(9.3)
where x[n] is the time-domain signal, X [k] is the frequency-domain representation,
and N is the length of the DFT. Taking x[n] as an EEG data window of length N ,
X [k] will have N uniformly-spaced frequency bins between ±(sampling rate)/2.
To achieve frequency bins with different spacings, x[n] can be zero-padded [28]. It
is important to note that, while zero padding provides an interpolated spectrum, it
does not increase the spectral resolution, which is limited to the length of the signal
window before zero-padding (i.e., spectral resolution sampling rate/the number
of signal samples).
Computation of the DFT/FFT inherently causes spectral leakage, where the signal
energy can “leak” into adjacent frequency bins. This leaked energy contributes to
what are known as undesirable side lobes in the spectrum, flanking the main lobe of
the desired signal energy. One approach to reducing spectral leakage is to multiply
Fig. 9.4 The extraction of
bandpower
-2
0
2
Bandpower
1-original
Time
0
0.5
1
4-smoothed
201
The signal is then rectified by squaring the signal or by computing its absolute value.
The resulting rectified peaks are temporally smoothed together using a lowpass filter.
This process is illustrated in Fig. 9.4. Although the smoothed signal tracks the
magnitude envelope of the frequency of interest, the resulting instantaneous magnitude estimate will be slightly delayed due to the filtering and smoothing steps. When
multiple-frequency band tracking is required, it is generally more efficient to use an
FFT- or AR-based method rather than using multiple bandpass filters and computing
the band power of each output.
In contrast to bandpower estimation, the FFT provides the full frequency spectrum
of the signal via a linear transform from the time to the frequency domain [28]. The
FFT efficiently computes the discrete Fourier transform (DFT) given below:
X [k]
N −1
n0
x[n]e(−2π jnk/N ),
(9.3)
where x[n] is the time-domain signal, X [k] is the frequency-domain representation,
and N is the length of the DFT. Taking x[n] as an EEG data window of length N ,
X [k] will have N uniformly-spaced frequency bins between ±(sampling rate)/2.
To achieve frequency bins with different spacings, x[n] can be zero-padded [28]. It
is important to note that, while zero padding provides an interpolated spectrum, it
does not increase the spectral resolution, which is limited to the length of the signal
window before zero-padding (i.e., spectral resolution sampling rate/the number
of signal samples).
Computation of the DFT/FFT inherently causes spectral leakage, where the signal
energy can “leak” into adjacent frequency bins. This leaked energy contributes to
what are known as undesirable side lobes in the spectrum, flanking the main lobe of
the desired signal energy. One approach to reducing spectral leakage is to multiply
Fig. 9.4 The extraction of
bandpower
-2
0
2
Bandpower
1-original
Time
0
0.5
1
4-smoothed