

9 Computational EEG Analysis for Brain-Computer Interfaces
199
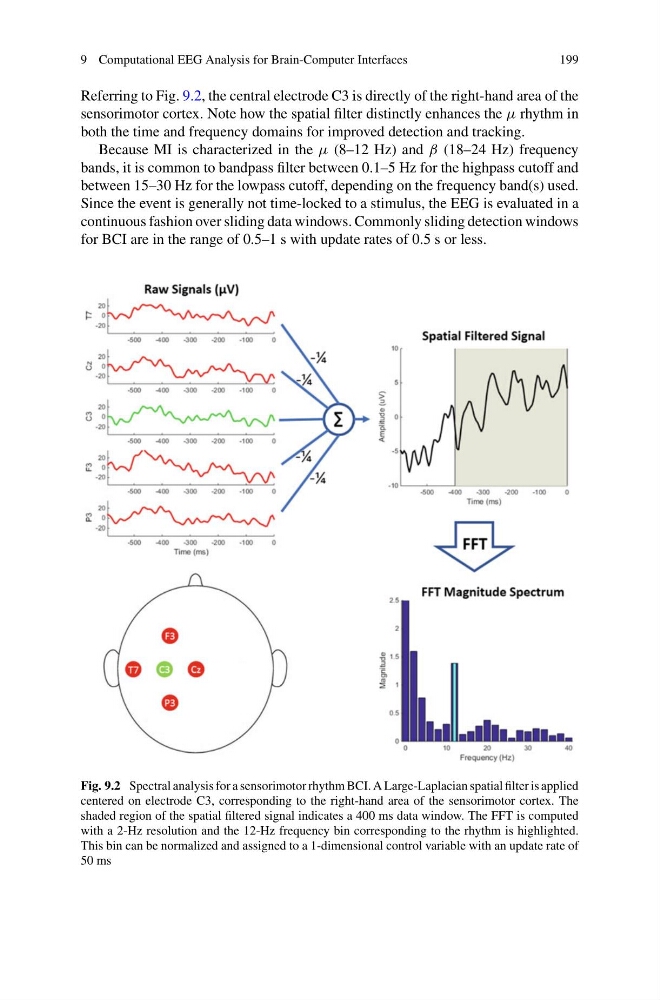
Referring to Fig. 9.2, the central electrode C3 is directly of the right-hand area of the
sensorimotor cortex. Note how the spatial filter distinctly enhances the μ rhythm in
both the time and frequency domains for improved detection and tracking.
Because MI is characterized in the μ (8–12 Hz) and β (18–24 Hz) frequency
bands, it is common to bandpass filter between 0.1–5 Hz for the highpass cutoff and
between 15–30 Hz for the lowpass cutoff, depending on the frequency band(s) used.
Since the event is generally not time-locked to a stimulus, the EEG is evaluated in a
continuous fashion over sliding data windows. Commonly sliding detection windows
for BCI are in the range of 0.5–1 s with update rates of 0.5 s or less.
Fig. 9.2 Spectral analysis for a sensorimotor rhythm BCI. A Large-Laplacian spatial filter is applied
centered on electrode C3, corresponding to the right-hand area of the sensorimotor cortex. The
shaded region of the spatial filtered signal indicates a 400 ms data window. The FFT is computed
with a 2-Hz resolution and the 12-Hz frequency bin corresponding to the rhythm is highlighted.
This bin can be normalized and assigned to a 1-dimensional control variable with an update rate of
50 ms
199
Referring to Fig. 9.2, the central electrode C3 is directly of the right-hand area of the
sensorimotor cortex. Note how the spatial filter distinctly enhances the μ rhythm in
both the time and frequency domains for improved detection and tracking.
Because MI is characterized in the μ (8–12 Hz) and β (18–24 Hz) frequency
bands, it is common to bandpass filter between 0.1–5 Hz for the highpass cutoff and
between 15–30 Hz for the lowpass cutoff, depending on the frequency band(s) used.
Since the event is generally not time-locked to a stimulus, the EEG is evaluated in a
continuous fashion over sliding data windows. Commonly sliding detection windows
for BCI are in the range of 0.5–1 s with update rates of 0.5 s or less.
Fig. 9.2 Spectral analysis for a sensorimotor rhythm BCI. A Large-Laplacian spatial filter is applied
centered on electrode C3, corresponding to the right-hand area of the sensorimotor cortex. The
shaded region of the spatial filtered signal indicates a 400 ms data window. The FFT is computed
with a 2-Hz resolution and the 12-Hz frequency bin corresponding to the rhythm is highlighted.
This bin can be normalized and assigned to a 1-dimensional control variable with an update rate of
50 ms