

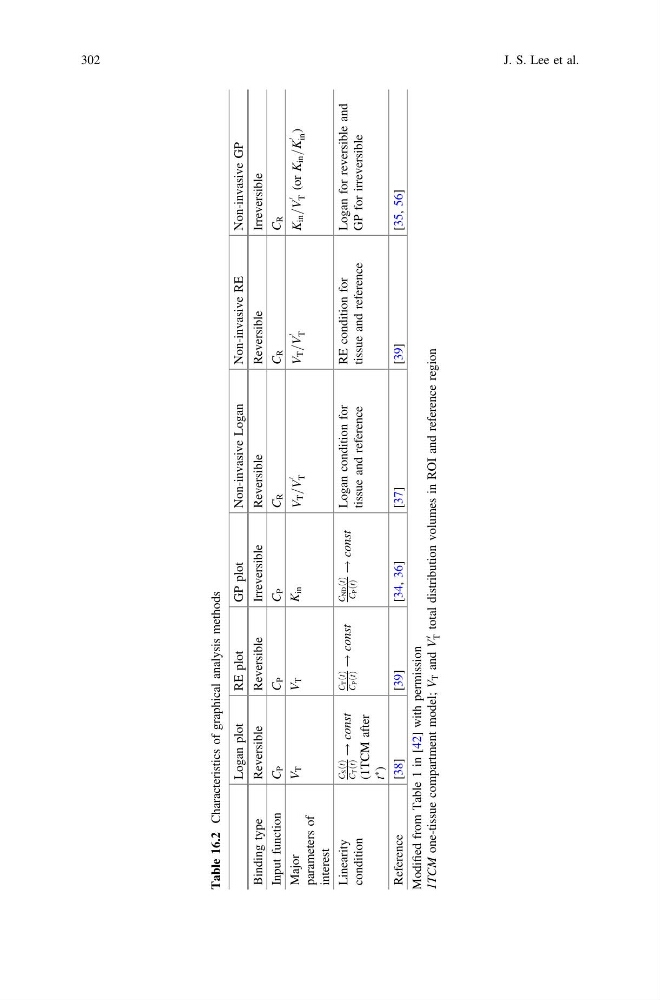
Table 16.2
Characteristics of graphical analysis methods
Logan plot
RE plot
GP plot
Non-invasive Logan
Non-invasive RE
Non-invasive GP
Binding type
Reversible
Reversible
Irreversible
Reversible
Reversible
Irreversible
Input function
C
P
C
P
C
P
C
R
C
R
C
R
Major
parameters of
interest
V
T
V
T
K
in
V
T
=V
0
T
V
T
=V
0
T
K
in
=V
0
T (or K
in
=K
0
in )
Linearity
condition
CS t
ð Þ
CT
t
ð Þ ! const
(1TCM after
t
Ã
)
CT t
ð Þ
CP
t
ð Þ ! const
CND t
ð Þ
CP
t
ð Þ ! const
Logan condition for
tissue and reference
RE condition for
tissue and reference
Logan for reversible and
GP for irreversible
Reference
[38]
[ 39]
[ 34, 36]
[ 37]
[ 39]
[ 35, 56]
Modified from Table 1 in [42] with permission
1TCM
one-tissue compartment model; V
T and V
0
T total distribution volumes in ROI and reference region
302
J. S. Lee et al.
Characteristics of graphical analysis methods
Logan plot
RE plot
GP plot
Non-invasive Logan
Non-invasive RE
Non-invasive GP
Binding type
Reversible
Reversible
Irreversible
Reversible
Reversible
Irreversible
Input function
C
P
C
P
C
P
C
R
C
R
C
R
Major
parameters of
interest
V
T
V
T
K
in
V
T
=V
0
T
V
T
=V
0
T
K
in
=V
0
T (or K
in
=K
0
in )
Linearity
condition
CS t
ð Þ
CT
t
ð Þ ! const
(1TCM after
t
Ã
)
CT t
ð Þ
CP
t
ð Þ ! const
CND t
ð Þ
CP
t
ð Þ ! const
Logan condition for
tissue and reference
RE condition for
tissue and reference
Logan for reversible and
GP for irreversible
Reference
[38]
[ 39]
[ 34, 36]
[ 37]
[ 39]
[ 35, 56]
Modified from Table 1 in [42] with permission
1TCM
one-tissue compartment model; V
T and V
0
T total distribution volumes in ROI and reference region
302
J. S. Lee et al.