

addressing the bias issue in the Logan plot [39] and bi-graphical analysis methods
for the quantification of slowly reversible radiotracers are also sometimes used [40,
41]. Each of the GA methods depend on different assumptions to simplify the
model equation, and only the latter portion of the measured data usually satisfies
these assumptions [42]. Because the violation of these assumptions and improper
selection of the linear fitting range leads to bias in the kinetic parameter estimation,
a proper understanding of the uptake mechanism in radiotracers and a careful
observation of the time course of measured data is necessary. The characteristics of
each GA method is summarized in Table 16.2, which is modified based on the
authors’ review of advances in graphical analysis [42].
Multiple linear regression models with more than one independent variable are
more complex but represent an accurate approach than the simple GA. For example,
by integrating (16.1), the following linear equation with two independent variables
(K 1 and k 2 ) can be obtained.
C T ðtÞ ¼ K 1
Z t
0
C p ðsÞds À k 2
Z t
0
C T ðsÞds
ð16:12Þ
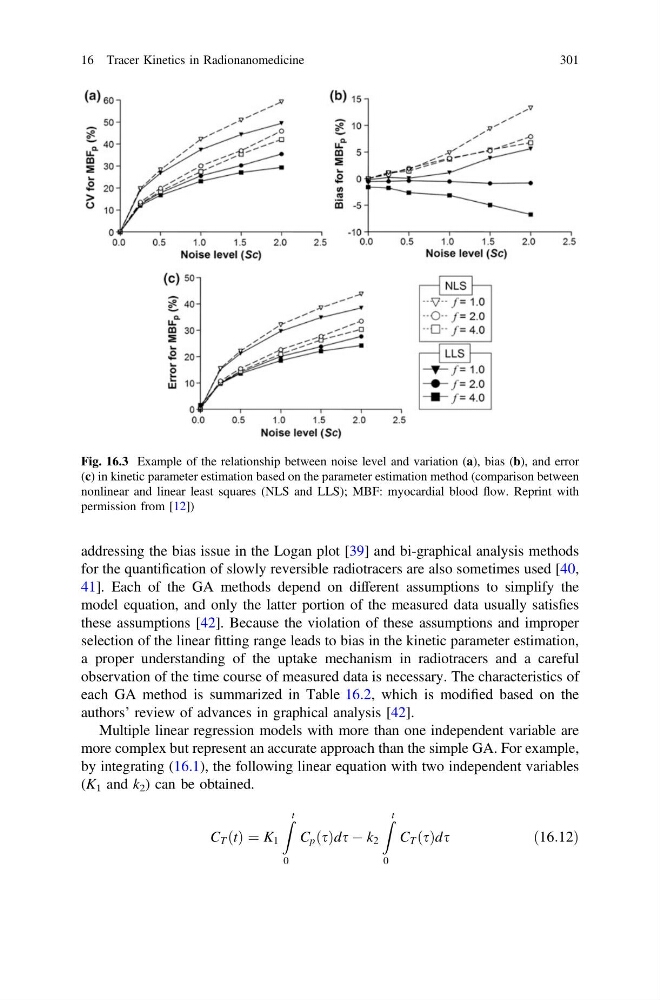
Fig. 16.3 Example of the relationship between noise level and variation (a), bias (b), and error
(c) in kinetic parameter estimation based on the parameter estimation method (comparison between
nonlinear and linear least squares (NLS and LLS); MBF: myocardial blood flow. Reprint with
permission from [12])
16 Tracer Kinetics in Radionanomedicine
301
for the quantification of slowly reversible radiotracers are also sometimes used [40,
41]. Each of the GA methods depend on different assumptions to simplify the
model equation, and only the latter portion of the measured data usually satisfies
these assumptions [42]. Because the violation of these assumptions and improper
selection of the linear fitting range leads to bias in the kinetic parameter estimation,
a proper understanding of the uptake mechanism in radiotracers and a careful
observation of the time course of measured data is necessary. The characteristics of
each GA method is summarized in Table 16.2, which is modified based on the
authors’ review of advances in graphical analysis [42].
Multiple linear regression models with more than one independent variable are
more complex but represent an accurate approach than the simple GA. For example,
by integrating (16.1), the following linear equation with two independent variables
(K 1 and k 2 ) can be obtained.
C T ðtÞ ¼ K 1
Z t
0
C p ðsÞds À k 2
Z t
0
C T ðsÞds
ð16:12Þ
Fig. 16.3 Example of the relationship between noise level and variation (a), bias (b), and error
(c) in kinetic parameter estimation based on the parameter estimation method (comparison between
nonlinear and linear least squares (NLS and LLS); MBF: myocardial blood flow. Reprint with
permission from [12])
16 Tracer Kinetics in Radionanomedicine
301