

Sometimes, correction factors for mitigating the partial volume and spillover
effects on the tissue time–activity curves are incorporated into model equations. The
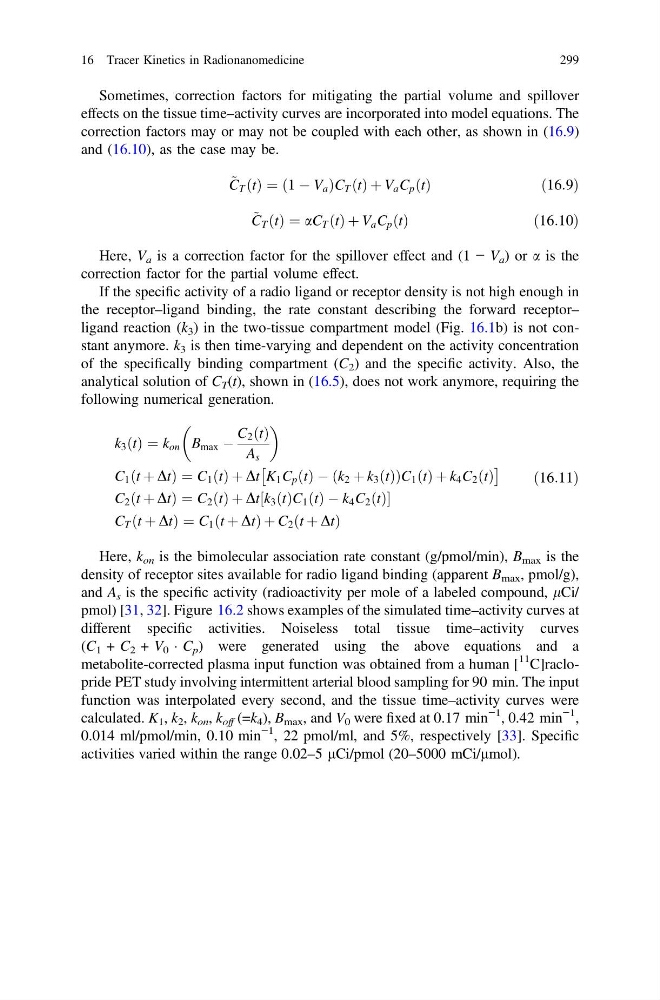
correction factors may or may not be coupled with each other, as shown in (16.9)
and (16.10), as the case may be.
~
C T ðtÞ ¼ ð1 À V a ÞC T ðtÞ þ V a C p ðtÞ
ð 16:9Þ
~
C T ðtÞ ¼ aC T ðtÞ þ V a C p ðtÞ
ð 16:10Þ
Here, V a is a correction factor for the spillover effect and (1 − V a ) or a is the
correction factor for the partial volume effect.
If the specific activity of a radio ligand or receptor density is not high enough in
the receptor–ligand binding, the rate constant describing the forward receptor–
ligand reaction (k 3 ) in the two-tissue compartment model (Fig. 16.1b) is not constant anymore. k 3 is then time-varying and dependent on the activity concentration
of the specifically binding compartment (C 2 ) and the specific activity. Also, the
analytical solution of C T (t), shown in (16.5), does not work anymore, requiring the
following numerical generation.
k 3 ðtÞ ¼ k on B max À
C 2 ðtÞ
A s
C 1 ðt þ DtÞ ¼ C 1 ðtÞ þ Dt K 1 C p ðtÞ À ðk 2 þ k 3 ðtÞÞC 1 ðtÞ þ k 4 C 2 ðtÞ
Â
Ã
C 2 ðt þ DtÞ ¼ C 2 ðtÞ þ Dt k 3 ðtÞC 1 ðtÞ À k 4 C 2 ðtÞ
½
C T ðt þ DtÞ ¼ C 1 ðt þ DtÞ þ C 2 ðt þ DtÞ
ð16:11Þ
Here, k on is the bimolecular association rate constant (g/pmol/min), B max is the
density of receptor sites available for radio ligand binding (apparent B max , pmol/g),
and A s is the specific activity (radioactivity per mole of a labeled compound, lCi/
pmol) [31, 32]. Figure 16.2 shows examples of the simulated time–activity curves at
different specific activities. Noiseless total tissue time–activity curves
(C 1 + C 2 + V 0 Á C p ) were generated using the above equations and a
metabolite-corrected plasma input function was obtained from a human [
11 C]raclopride PET study involving intermittent arterial blood sampling for 90 min. The input
function was interpolated every second, and the tissue time–activity curves were
calculated. K 1 , k 2 , k on , k off (=k 4 ), B max , and V 0 were fixed at 0.17 min
−1 , 0.42 min
−1 ,
0.014 ml/pmol/min, 0.10 min
−1 , 22 pmol/ml, and 5%, respectively [33]. Specific
activities varied within the range 0.02–5 lCi/pmol (20–5000 mCi/lmol).
16 Tracer Kinetics in Radionanomedicine
299
effects on the tissue time–activity curves are incorporated into model equations. The
correction factors may or may not be coupled with each other, as shown in (16.9)
and (16.10), as the case may be.
~
C T ðtÞ ¼ ð1 À V a ÞC T ðtÞ þ V a C p ðtÞ
ð 16:9Þ
~
C T ðtÞ ¼ aC T ðtÞ þ V a C p ðtÞ
ð 16:10Þ
Here, V a is a correction factor for the spillover effect and (1 − V a ) or a is the
correction factor for the partial volume effect.
If the specific activity of a radio ligand or receptor density is not high enough in
the receptor–ligand binding, the rate constant describing the forward receptor–
ligand reaction (k 3 ) in the two-tissue compartment model (Fig. 16.1b) is not constant anymore. k 3 is then time-varying and dependent on the activity concentration
of the specifically binding compartment (C 2 ) and the specific activity. Also, the
analytical solution of C T (t), shown in (16.5), does not work anymore, requiring the
following numerical generation.
k 3 ðtÞ ¼ k on B max À
C 2 ðtÞ
A s
C 1 ðt þ DtÞ ¼ C 1 ðtÞ þ Dt K 1 C p ðtÞ À ðk 2 þ k 3 ðtÞÞC 1 ðtÞ þ k 4 C 2 ðtÞ
Â
Ã
C 2 ðt þ DtÞ ¼ C 2 ðtÞ þ Dt k 3 ðtÞC 1 ðtÞ À k 4 C 2 ðtÞ
½
C T ðt þ DtÞ ¼ C 1 ðt þ DtÞ þ C 2 ðt þ DtÞ
ð16:11Þ
Here, k on is the bimolecular association rate constant (g/pmol/min), B max is the
density of receptor sites available for radio ligand binding (apparent B max , pmol/g),
and A s is the specific activity (radioactivity per mole of a labeled compound, lCi/
pmol) [31, 32]. Figure 16.2 shows examples of the simulated time–activity curves at
different specific activities. Noiseless total tissue time–activity curves
(C 1 + C 2 + V 0 Á C p ) were generated using the above equations and a
metabolite-corrected plasma input function was obtained from a human [
11 C]raclopride PET study involving intermittent arterial blood sampling for 90 min. The input
function was interpolated every second, and the tissue time–activity curves were
calculated. K 1 , k 2 , k on , k off (=k 4 ), B max , and V 0 were fixed at 0.17 min
−1 , 0.42 min
−1 ,
0.014 ml/pmol/min, 0.10 min
−1 , 22 pmol/ml, and 5%, respectively [33]. Specific
activities varied within the range 0.02–5 lCi/pmol (20–5000 mCi/lmol).
16 Tracer Kinetics in Radionanomedicine
299