

Solving the above equation for C T (t) gives
C T ðtÞ ¼ K 1
Z t
0
C p ðsÞe
Àk 2 ðtÀsÞ ds ¼ K 1 C p ðtÞ e
Àk 2 t
;
ð16:2Þ
where ⊗ denotes a convolution integral.
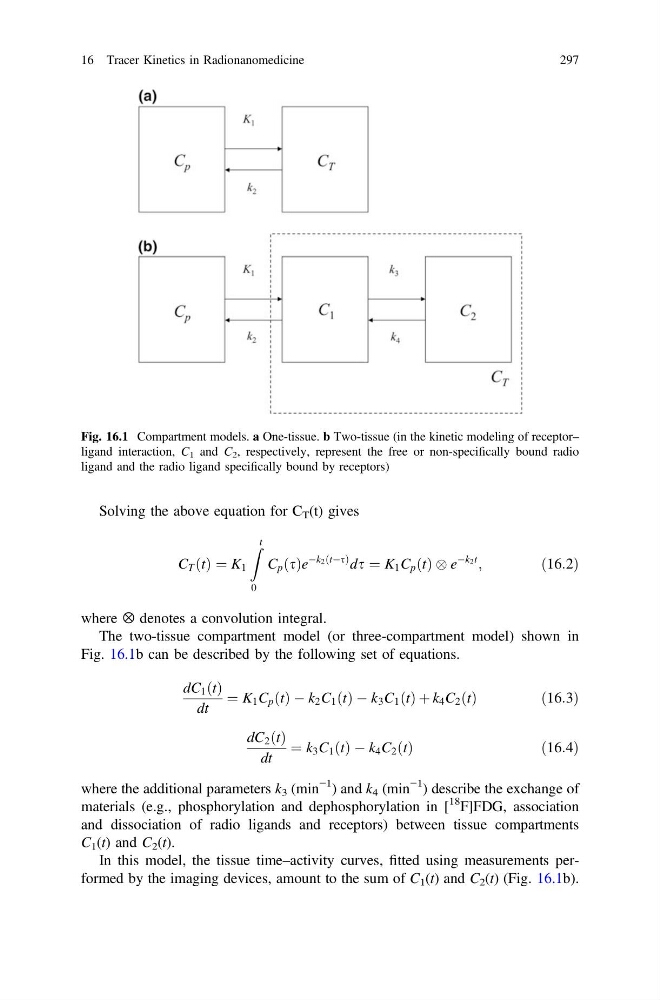
The two-tissue compartment model (or three-compartment model) shown in
Fig. 16.1b can be described by the following set of equations.
dC 1 ðtÞ
dt
¼ K 1 C p ðtÞ À k 2 C 1 ðtÞ À k 3 C 1 ðtÞ þ k 4 C 2 ðtÞ
ð 16:3Þ
dC 2 ðtÞ
dt
¼ k 3 C 1 ðtÞ À k 4 C 2 ðtÞ
ð 16:4Þ
where the additional parameters k 3 (min
−1 ) and k 4 (min
−1 ) describe the exchange of
materials (e.g., phosphorylation and dephosphorylation in [
18 F]FDG, association
and dissociation of radio ligands and receptors) between tissue compartments
C 1 (t) and C 2 (t).
In this model, the tissue time–activity curves, fitted using measurements performed by the imaging devices, amount to the sum of C 1 (t) and C 2 (t) (Fig. 16.1b).
Fig. 16.1 Compartment models. a One-tissue. b Two-tissue (in the kinetic modeling of receptor–
ligand interaction, C 1 and C 2 , respectively, represent the free or non-specifically bound radio
ligand and the radio ligand specifically bound by receptors)
16 Tracer Kinetics in Radionanomedicine
297
C T ðtÞ ¼ K 1
Z t
0
C p ðsÞe
Àk 2 ðtÀsÞ ds ¼ K 1 C p ðtÞ e
Àk 2 t
;
ð16:2Þ
where ⊗ denotes a convolution integral.
The two-tissue compartment model (or three-compartment model) shown in
Fig. 16.1b can be described by the following set of equations.
dC 1 ðtÞ
dt
¼ K 1 C p ðtÞ À k 2 C 1 ðtÞ À k 3 C 1 ðtÞ þ k 4 C 2 ðtÞ
ð 16:3Þ
dC 2 ðtÞ
dt
¼ k 3 C 1 ðtÞ À k 4 C 2 ðtÞ
ð 16:4Þ
where the additional parameters k 3 (min
−1 ) and k 4 (min
−1 ) describe the exchange of
materials (e.g., phosphorylation and dephosphorylation in [
18 F]FDG, association
and dissociation of radio ligands and receptors) between tissue compartments
C 1 (t) and C 2 (t).
In this model, the tissue time–activity curves, fitted using measurements performed by the imaging devices, amount to the sum of C 1 (t) and C 2 (t) (Fig. 16.1b).
Fig. 16.1 Compartment models. a One-tissue. b Two-tissue (in the kinetic modeling of receptor–
ligand interaction, C 1 and C 2 , respectively, represent the free or non-specifically bound radio
ligand and the radio ligand specifically bound by receptors)
16 Tracer Kinetics in Radionanomedicine
297