

obtain individual input functions. Unlike IDIF, the accuracy of PBIF does not
depend upon partial volume effects, scanner characteristics, or reconstruction
algorithms, and neither does it require post-processing of images. Because of the
interindividual variability in the tracer metabolite fraction and peak estimation error,
PBIF has limited accuracy in case of radiotracers with low parent concentration at
the end of the scan [20].
Reference tissue approaches are widely used for radio ligands that bind to some
molecular target but possess a reliable reference region devoid of specific binding.
One can derive a relationship between reference regions and ROIs with specific
binding under the assumption that they share the input function and that the
non-displaceable volume of distribution (V ND ) is constant throughout the regions
[11, 26, 27]. The simplified reference tissue model (SRTM) is also popular because
it has fewer parameters to be estimated than the full model, and multiple linear
models for SRTM are also available [13, 14, 26, 28]. Details of these approaches
have been described in the following sections.
16.3 Compartment Modeling
Biological systems can be modelled as a combination of compartments linked by
kinetic processes (i.e., the exchange of materials among compartments).
Compartment modeling is commonly used in tracer kinetic analyses. In the compartment model, each compartment represents an effective radiotracer amount
occupying a distinct physical space and having different chemical forms or pharmacological states. The radiotracer in the compartment should be well-mixed,
kinetically homogeneous, and distinct. Compartment models frequently used for
in vivo nuclear imaging studies are shown in Fig. 16.1. In this Fig., the arrows
indicate the paths followed by the radiotracer [5, 29, 30]. Radiotracers within a
tissue can be modeled with more than one compartment depending on the kinetic
properties of the tissue.
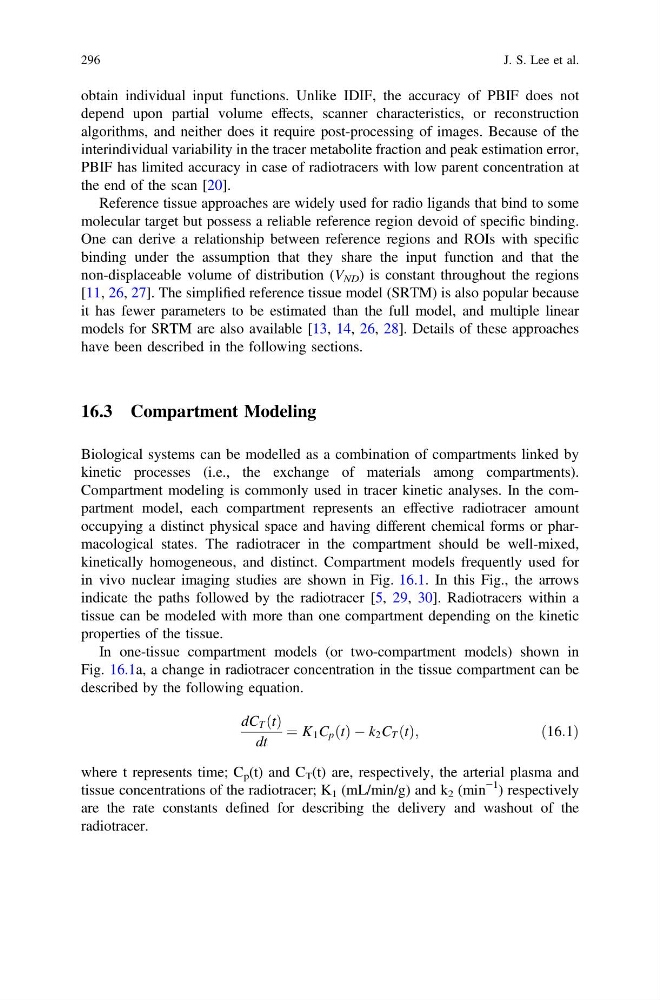
In one-tissue compartment models (or two-compartment models) shown in
Fig. 16.1a, a change in radiotracer concentration in the tissue compartment can be
described by the following equation.
dC T ðtÞ
dt
¼ K 1 C p ðtÞ À k 2 C T ðtÞ;
ð16:1Þ
where t represents time; C p (t) and C T (t) are, respectively, the arterial plasma and
tissue concentrations of the radiotracer; K 1 (mL/min/g) and k 2 (min
−1 ) respectively
are the rate constants defined for describing the delivery and washout of the
radiotracer.
296
J. S. Lee et al.
depend upon partial volume effects, scanner characteristics, or reconstruction
algorithms, and neither does it require post-processing of images. Because of the
interindividual variability in the tracer metabolite fraction and peak estimation error,
PBIF has limited accuracy in case of radiotracers with low parent concentration at
the end of the scan [20].
Reference tissue approaches are widely used for radio ligands that bind to some
molecular target but possess a reliable reference region devoid of specific binding.
One can derive a relationship between reference regions and ROIs with specific
binding under the assumption that they share the input function and that the
non-displaceable volume of distribution (V ND ) is constant throughout the regions
[11, 26, 27]. The simplified reference tissue model (SRTM) is also popular because
it has fewer parameters to be estimated than the full model, and multiple linear
models for SRTM are also available [13, 14, 26, 28]. Details of these approaches
have been described in the following sections.
16.3 Compartment Modeling
Biological systems can be modelled as a combination of compartments linked by
kinetic processes (i.e., the exchange of materials among compartments).
Compartment modeling is commonly used in tracer kinetic analyses. In the compartment model, each compartment represents an effective radiotracer amount
occupying a distinct physical space and having different chemical forms or pharmacological states. The radiotracer in the compartment should be well-mixed,
kinetically homogeneous, and distinct. Compartment models frequently used for
in vivo nuclear imaging studies are shown in Fig. 16.1. In this Fig., the arrows
indicate the paths followed by the radiotracer [5, 29, 30]. Radiotracers within a
tissue can be modeled with more than one compartment depending on the kinetic
properties of the tissue.
In one-tissue compartment models (or two-compartment models) shown in
Fig. 16.1a, a change in radiotracer concentration in the tissue compartment can be
described by the following equation.
dC T ðtÞ
dt
¼ K 1 C p ðtÞ À k 2 C T ðtÞ;
ð16:1Þ
where t represents time; C p (t) and C T (t) are, respectively, the arterial plasma and
tissue concentrations of the radiotracer; K 1 (mL/min/g) and k 2 (min
−1 ) respectively
are the rate constants defined for describing the delivery and washout of the
radiotracer.
296
J. S. Lee et al.