

respectively. At the end of the treatment (i.e., July 8), the global impact appears
minor on the two cPZ, DCC1.2 and DCC1.3, whereas the strong reductive conditions were responsible for 90% of the reduction yield.
Evolution of Alkalinity Expressed as Bicarbonate and of Chloride Content
Table 6.18 presents alkalinity expressed as bicarbonate concentration and chloride
concentration in the sampled water at two levels (H and B) of each control piezometer of line 1.
Bicarbonate (HCO 3
À ), already rather high, marginally increased, except in
DCC1.1H and B. This increase was rather assigned to dithionite degradation products. Chloride content (Cl
À ), already rather high in line 1 (compared to the Néry
drinking water), increased especially at the first two controls (DCC1.1 and DCC1.2).
It remains in the same order of magnitude in DCC1.3. As the increases were mainly
due to dithionite solutions, which contains chloride ions, the monitoring of Cl
À can
be used to trace the dithionite arrival on the level of a cPZ. The acquired data clearly
confirmed that dithionite did not reach DCC1.3.
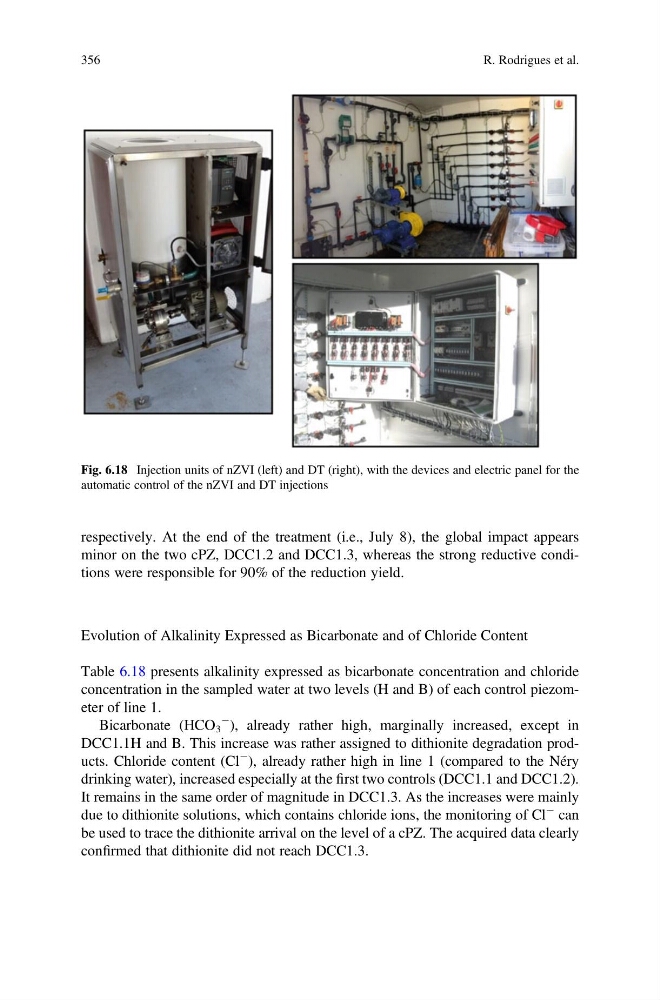
Fig. 6.18 Injection units of nZVI (left) and DT (right), with the devices and electric panel for the
automatic control of the nZVI and DT injections
356
R. Rodrigues et al.
minor on the two cPZ, DCC1.2 and DCC1.3, whereas the strong reductive conditions were responsible for 90% of the reduction yield.
Evolution of Alkalinity Expressed as Bicarbonate and of Chloride Content
Table 6.18 presents alkalinity expressed as bicarbonate concentration and chloride
concentration in the sampled water at two levels (H and B) of each control piezometer of line 1.
Bicarbonate (HCO 3
À ), already rather high, marginally increased, except in
DCC1.1H and B. This increase was rather assigned to dithionite degradation products. Chloride content (Cl
À ), already rather high in line 1 (compared to the Néry
drinking water), increased especially at the first two controls (DCC1.1 and DCC1.2).
It remains in the same order of magnitude in DCC1.3. As the increases were mainly
due to dithionite solutions, which contains chloride ions, the monitoring of Cl
À can
be used to trace the dithionite arrival on the level of a cPZ. The acquired data clearly
confirmed that dithionite did not reach DCC1.3.
Fig. 6.18 Injection units of nZVI (left) and DT (right), with the devices and electric panel for the
automatic control of the nZVI and DT injections
356
R. Rodrigues et al.