

between 8.77 Â 10
À4 and 8.92 Â 10
À4 m
3 s
À1 , an annual throughput of about
27,668–28,135 m
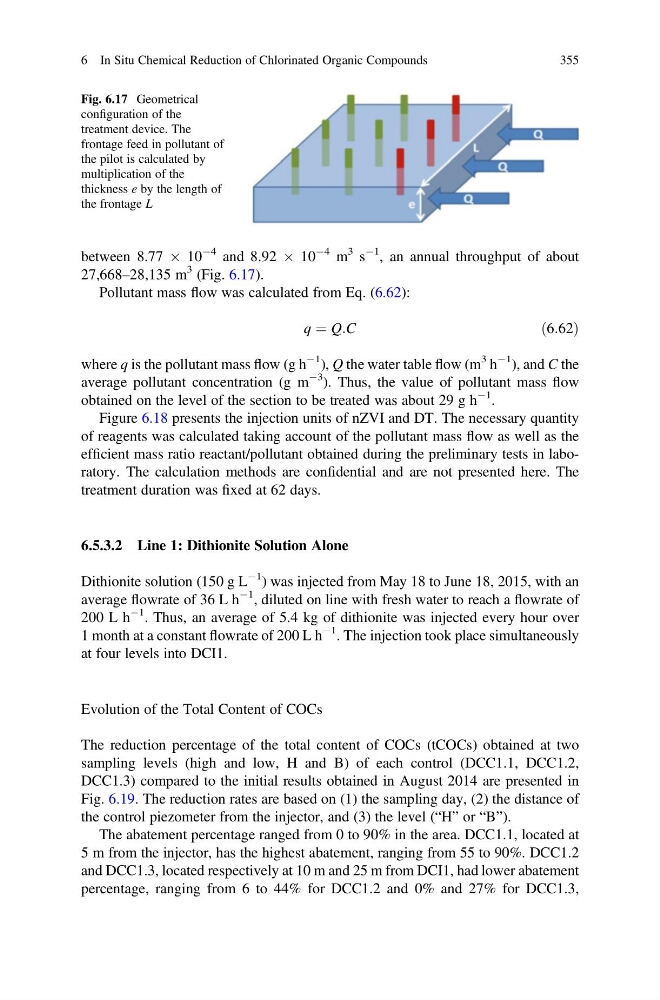
3 (Fig. 6.17).
Pollutant mass flow was calculated from Eq. (6.62):
q ¼ Q:C
ð6:62Þ
where q is the pollutant mass flow (g h
À1 ), Q the water table flow (m
3 h
À1 ), and C the
average pollutant concentration (g m
À3 ). Thus, the value of pollutant mass flow
obtained on the level of the section to be treated was about 29 g h
À1 .
Figure 6.18 presents the injection units of nZVI and DT. The necessary quantity
of reagents was calculated taking account of the pollutant mass flow as well as the
efficient mass ratio reactant/pollutant obtained during the preliminary tests in laboratory. The calculation methods are confidential and are not presented here. The
treatment duration was fixed at 62 days.
6.5.3.2 Line 1: Dithionite Solution Alone
Dithionite solution (150 g L
À1 ) was injected from May 18 to June 18, 2015, with an
average flowrate of 36 L h
À1 , diluted on line with fresh water to reach a flowrate of
200 L h
À1 . Thus, an average of 5.4 kg of dithionite was injected every hour over
1 month at a constant flowrate of 200 L h
À1 . The injection took place simultaneously
at four levels into DCI1.
Evolution of the Total Content of COCs
The reduction percentage of the total content of COCs (tCOCs) obtained at two
sampling levels (high and low, H and B) of each control (DCC1.1, DCC1.2,
DCC1.3) compared to the initial results obtained in August 2014 are presented in
Fig. 6.19. The reduction rates are based on (1) the sampling day, (2) the distance of
the control piezometer from the injector, and (3) the level (“H” or “B”).
The abatement percentage ranged from 0 to 90% in the area. DCC1.1, located at
5 m from the injector, has the highest abatement, ranging from 55 to 90%. DCC1.2
and DCC1.3, located respectively at 10 m and 25 m from DCI1, had lower abatement
percentage, ranging from 6 to 44% for DCC1.2 and 0% and 27% for DCC1.3,
Fig. 6.17 Geometrical
configuration of the
treatment device. The
frontage feed in pollutant of
the pilot is calculated by
multiplication of the
thickness e by the length of
the frontage L
6 In Situ Chemical Reduction of Chlorinated Organic Compounds
355
À4 and 8.92 Â 10
À4 m
3 s
À1 , an annual throughput of about
27,668–28,135 m
3 (Fig. 6.17).
Pollutant mass flow was calculated from Eq. (6.62):
q ¼ Q:C
ð6:62Þ
where q is the pollutant mass flow (g h
À1 ), Q the water table flow (m
3 h
À1 ), and C the
average pollutant concentration (g m
À3 ). Thus, the value of pollutant mass flow
obtained on the level of the section to be treated was about 29 g h
À1 .
Figure 6.18 presents the injection units of nZVI and DT. The necessary quantity
of reagents was calculated taking account of the pollutant mass flow as well as the
efficient mass ratio reactant/pollutant obtained during the preliminary tests in laboratory. The calculation methods are confidential and are not presented here. The
treatment duration was fixed at 62 days.
6.5.3.2 Line 1: Dithionite Solution Alone
Dithionite solution (150 g L
À1 ) was injected from May 18 to June 18, 2015, with an
average flowrate of 36 L h
À1 , diluted on line with fresh water to reach a flowrate of
200 L h
À1 . Thus, an average of 5.4 kg of dithionite was injected every hour over
1 month at a constant flowrate of 200 L h
À1 . The injection took place simultaneously
at four levels into DCI1.
Evolution of the Total Content of COCs
The reduction percentage of the total content of COCs (tCOCs) obtained at two
sampling levels (high and low, H and B) of each control (DCC1.1, DCC1.2,
DCC1.3) compared to the initial results obtained in August 2014 are presented in
Fig. 6.19. The reduction rates are based on (1) the sampling day, (2) the distance of
the control piezometer from the injector, and (3) the level (“H” or “B”).
The abatement percentage ranged from 0 to 90% in the area. DCC1.1, located at
5 m from the injector, has the highest abatement, ranging from 55 to 90%. DCC1.2
and DCC1.3, located respectively at 10 m and 25 m from DCI1, had lower abatement
percentage, ranging from 6 to 44% for DCC1.2 and 0% and 27% for DCC1.3,
Fig. 6.17 Geometrical
configuration of the
treatment device. The
frontage feed in pollutant of
the pilot is calculated by
multiplication of the
thickness e by the length of
the frontage L
6 In Situ Chemical Reduction of Chlorinated Organic Compounds
355