

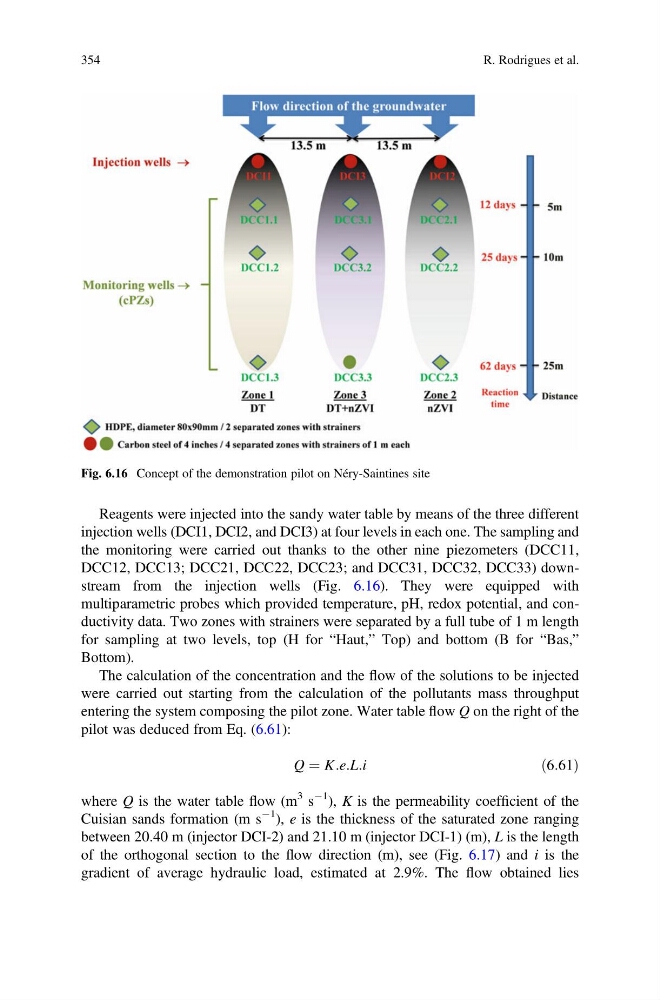
Reagents were injected into the sandy water table by means of the three different
injection wells (DCI1, DCI2, and DCI3) at four levels in each one. The sampling and
the monitoring were carried out thanks to the other nine piezometers (DCC11,
DCC12, DCC13; DCC21, DCC22, DCC23; and DCC31, DCC32, DCC33) downstream from the injection wells (Fig. 6.16). They were equipped with
multiparametric probes which provided temperature, pH, redox potential, and conductivity data. Two zones with strainers were separated by a full tube of 1 m length
for sampling at two levels, top (H for “Haut,” Top) and bottom (B for “Bas,”
Bottom).
The calculation of the concentration and the flow of the solutions to be injected
were carried out starting from the calculation of the pollutants mass throughput
entering the system composing the pilot zone. Water table flow Q on the right of the
pilot was deduced from Eq. (6.61):
Q ¼ K:e:L:i
ð6:61Þ
where Q is the water table flow (m
3 s
À1 ), K is the permeability coefficient of the
Cuisian sands formation (m s
À1 ), e is the thickness of the saturated zone ranging
between 20.40 m (injector DCI-2) and 21.10 m (injector DCI-1) (m), L is the length
of the orthogonal section to the flow direction (m), see (Fig. 6.17) and i is the
gradient of average hydraulic load, estimated at 2.9%. The flow obtained lies
Fig. 6.16 Concept of the demonstration pilot on Néry-Saintines site
354
R. Rodrigues et al.
injection wells (DCI1, DCI2, and DCI3) at four levels in each one. The sampling and
the monitoring were carried out thanks to the other nine piezometers (DCC11,
DCC12, DCC13; DCC21, DCC22, DCC23; and DCC31, DCC32, DCC33) downstream from the injection wells (Fig. 6.16). They were equipped with
multiparametric probes which provided temperature, pH, redox potential, and conductivity data. Two zones with strainers were separated by a full tube of 1 m length
for sampling at two levels, top (H for “Haut,” Top) and bottom (B for “Bas,”
Bottom).
The calculation of the concentration and the flow of the solutions to be injected
were carried out starting from the calculation of the pollutants mass throughput
entering the system composing the pilot zone. Water table flow Q on the right of the
pilot was deduced from Eq. (6.61):
Q ¼ K:e:L:i
ð6:61Þ
where Q is the water table flow (m
3 s
À1 ), K is the permeability coefficient of the
Cuisian sands formation (m s
À1 ), e is the thickness of the saturated zone ranging
between 20.40 m (injector DCI-2) and 21.10 m (injector DCI-1) (m), L is the length
of the orthogonal section to the flow direction (m), see (Fig. 6.17) and i is the
gradient of average hydraulic load, estimated at 2.9%. The flow obtained lies
Fig. 6.16 Concept of the demonstration pilot on Néry-Saintines site
354
R. Rodrigues et al.