

Evolution of TCE, cis-1,2-DCE, 1,1-DCE, and VC Content
Table 6.19 presents the individual evolutions of TCE, cis-1,2-DCE, 1,1-DCE, and
VC content in the cPZs of line 1. In DCC1.1, a decrease in the four compounds was
observed between June 2 and July 8. At both levels, an abatement of more than 80%,
and up to 95%, for TCE, cis-1,2-DCE, 1,1-DCE, and VC, was obtained.
In DCC1.2, the reduction of the tCOCs was related to 1,1-DCE and, in a lesser
extent, to VC, with an abatement reaching 80–90% and 42–50%, respectively,
between June 2 and June 22. From June 22, TCE content was decreased by 25%.
This phenomenon was accompanied by an increase in cis-1,2-DCE content by
18–20%, of 1,1-DCE content by 700–1300%, and of VC content by 100–150%.
This result highlights the rapid dechlorination rate of both TCE and cis-1,2-DCE by
dithionite (both undergo reductive dechlorination), while both 1,1-DCE and VC
accumulated.
In DCC1.3, two different behaviors were observed depending on the sampling
depth. At À10 m, TCE and cis-1,2-DCE content remained unchanged, and only
1,1-DCE and VC appeared impacted. From June 2 to July 8, 1,1-DCE content
increased drastically whereas VC content decreased by 31%. At À20 m, TCE
content decreased by 60%. In the same time, cis-1,2-DCE and 1,1-DCE content
increased by 80 and 165%, respectively, while VC content decreased by 20%.
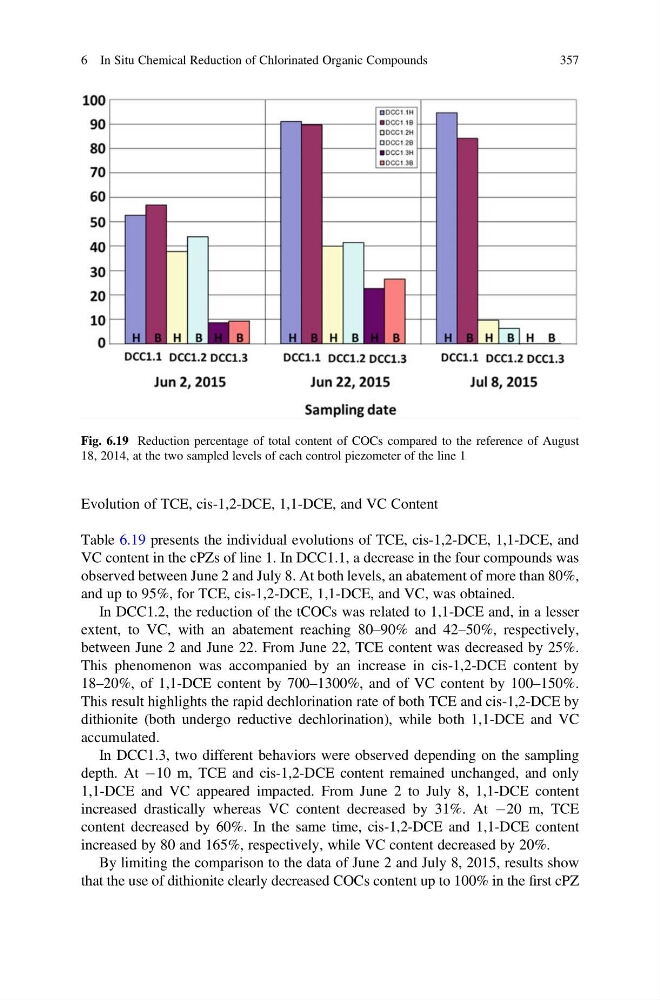
By limiting the comparison to the data of June 2 and July 8, 2015, results show
that the use of dithionite clearly decreased COCs content up to 100% in the first cPZ
Fig. 6.19 Reduction percentage of total content of COCs compared to the reference of August
18, 2014, at the two sampled levels of each control piezometer of the line 1
6 In Situ Chemical Reduction of Chlorinated Organic Compounds
357
Table 6.19 presents the individual evolutions of TCE, cis-1,2-DCE, 1,1-DCE, and
VC content in the cPZs of line 1. In DCC1.1, a decrease in the four compounds was
observed between June 2 and July 8. At both levels, an abatement of more than 80%,
and up to 95%, for TCE, cis-1,2-DCE, 1,1-DCE, and VC, was obtained.
In DCC1.2, the reduction of the tCOCs was related to 1,1-DCE and, in a lesser
extent, to VC, with an abatement reaching 80–90% and 42–50%, respectively,
between June 2 and June 22. From June 22, TCE content was decreased by 25%.
This phenomenon was accompanied by an increase in cis-1,2-DCE content by
18–20%, of 1,1-DCE content by 700–1300%, and of VC content by 100–150%.
This result highlights the rapid dechlorination rate of both TCE and cis-1,2-DCE by
dithionite (both undergo reductive dechlorination), while both 1,1-DCE and VC
accumulated.
In DCC1.3, two different behaviors were observed depending on the sampling
depth. At À10 m, TCE and cis-1,2-DCE content remained unchanged, and only
1,1-DCE and VC appeared impacted. From June 2 to July 8, 1,1-DCE content
increased drastically whereas VC content decreased by 31%. At À20 m, TCE
content decreased by 60%. In the same time, cis-1,2-DCE and 1,1-DCE content
increased by 80 and 165%, respectively, while VC content decreased by 20%.
By limiting the comparison to the data of June 2 and July 8, 2015, results show
that the use of dithionite clearly decreased COCs content up to 100% in the first cPZ
Fig. 6.19 Reduction percentage of total content of COCs compared to the reference of August
18, 2014, at the two sampled levels of each control piezometer of the line 1
6 In Situ Chemical Reduction of Chlorinated Organic Compounds
357