

2.7.2.6 Technical and Economic Analysis
A techno-economic analysis was conducted on the basis of laboratory tests and field
tests carried out as part of the SILPHES project. The characteristics of the dummy
case study, and those of chlorinated organic products (pollution source), are reported
in Table 2.16.
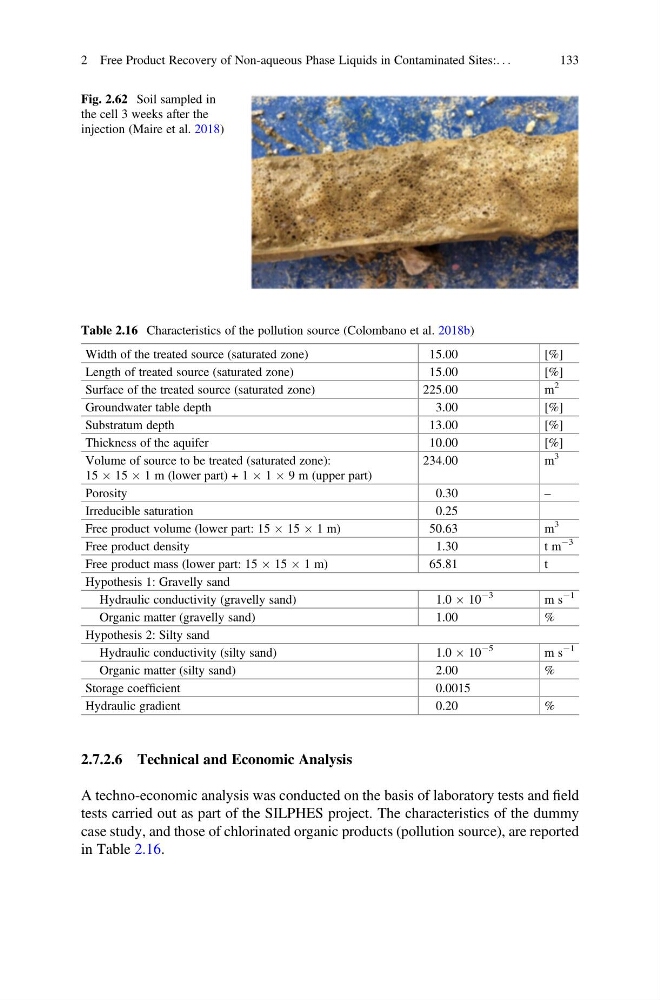
Fig. 2.62 Soil sampled in
the cell 3 weeks after the
injection (Maire et al. 2018)
Table 2.16 Characteristics of the pollution source (Colombano et al. 2018b)
Width of the treated source (saturated zone)
15.00
[%]
Length of treated source (saturated zone)
15.00
[%]
Surface of the treated source (saturated zone)
225.00
m
2
Groundwater table depth
3.00
[%]
Substratum depth
13.00
[%]
Thickness of the aquifer
10.00
[%]
Volume of source to be treated (saturated zone):
15 Â 15 Â 1 m (lower part) + 1 Â 1 Â 9 m (upper part)
234.00
m
3
Porosity
0.30
–
Irreducible saturation
0.25
Free product volume (lower part: 15 Â 15 Â 1 m)
50.63
m
3
Free product density
1.30
t m
À3
Free product mass (lower part: 15 Â 15 Â 1 m)
65.81
t
Hypothesis 1: Gravelly sand
Hydraulic conductivity (gravelly sand)
1.0 Â 10
À3
m s
À1
Organic matter (gravelly sand)
1.00
%
Hypothesis 2: Silty sand
Hydraulic conductivity (silty sand)
1.0 Â 10
À5
m s
À1
Organic matter (silty sand)
2.00
%
Storage coefficient
0.0015
Hydraulic gradient
0.20
%
2 Free Product Recovery of Non-aqueous Phase Liquids in Contaminated Sites:. . .
133
A techno-economic analysis was conducted on the basis of laboratory tests and field
tests carried out as part of the SILPHES project. The characteristics of the dummy
case study, and those of chlorinated organic products (pollution source), are reported
in Table 2.16.
Fig. 2.62 Soil sampled in
the cell 3 weeks after the
injection (Maire et al. 2018)
Table 2.16 Characteristics of the pollution source (Colombano et al. 2018b)
Width of the treated source (saturated zone)
15.00
[%]
Length of treated source (saturated zone)
15.00
[%]
Surface of the treated source (saturated zone)
225.00
m
2
Groundwater table depth
3.00
[%]
Substratum depth
13.00
[%]
Thickness of the aquifer
10.00
[%]
Volume of source to be treated (saturated zone):
15 Â 15 Â 1 m (lower part) + 1 Â 1 Â 9 m (upper part)
234.00
m
3
Porosity
0.30
–
Irreducible saturation
0.25
Free product volume (lower part: 15 Â 15 Â 1 m)
50.63
m
3
Free product density
1.30
t m
À3
Free product mass (lower part: 15 Â 15 Â 1 m)
65.81
t
Hypothesis 1: Gravelly sand
Hydraulic conductivity (gravelly sand)
1.0 Â 10
À3
m s
À1
Organic matter (gravelly sand)
1.00
%
Hypothesis 2: Silty sand
Hydraulic conductivity (silty sand)
1.0 Â 10
À5
m s
À1
Organic matter (silty sand)
2.00
%
Storage coefficient
0.0015
Hydraulic gradient
0.20
%
2 Free Product Recovery of Non-aqueous Phase Liquids in Contaminated Sites:. . .
133