

lifetime in the ground (Fig. 2.62). Finally, in contrast to surfactant flushing, no
DNAPL droplets were observed in soils treated with surfactant foam flushing.
For technical reasons, the foam was injected successively into two sleeve pipes
followed by injections into two others. This implied a reduced DNAPL convergence
toward the recovery wells. Moreover, the actual quantities of DNAPL recovered in
recovery wells were difficult to quantify.
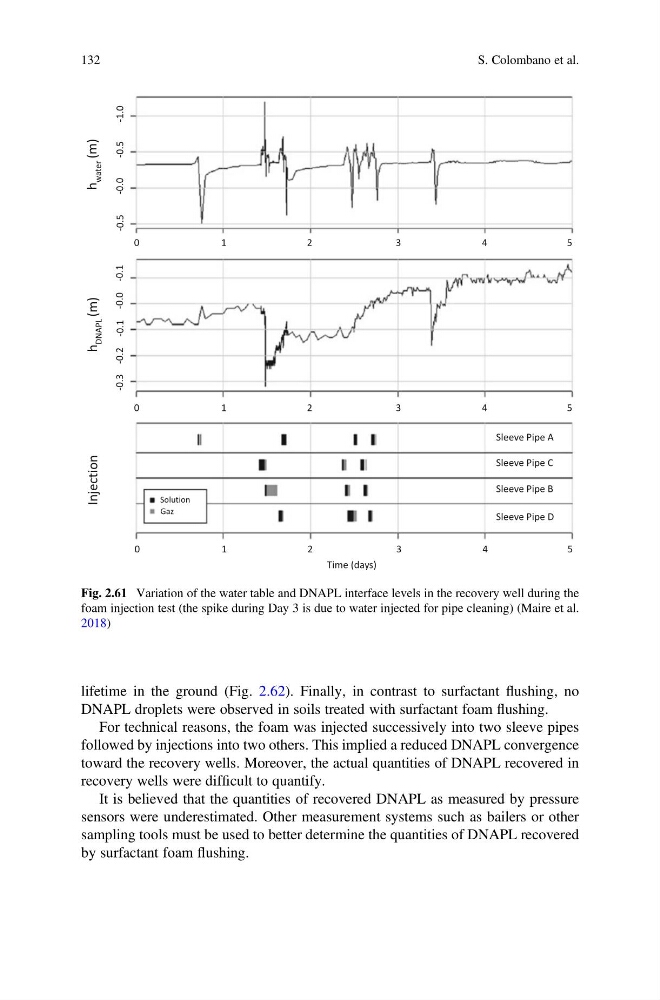
It is believed that the quantities of recovered DNAPL as measured by pressure
sensors were underestimated. Other measurement systems such as bailers or other
sampling tools must be used to better determine the quantities of DNAPL recovered
by surfactant foam flushing.
h
water (m)
h
DNAPL (m)
-0.5
-0.0
-0.5
-1.0
-0.2
-0.3
-0.1 -0.0 -0.1
Injection
Sleeve Pipe A
Sleeve Pipe C
Sleeve Pipe B
Sleeve Pipe D
0
1
2
3
4
5
0
1
2
3
4
5
0
1
2
3
4
5
Time (days)
Solution
Gaz
Fig. 2.61 Variation of the water table and DNAPL interface levels in the recovery well during the
foam injection test (the spike during Day 3 is due to water injected for pipe cleaning) (Maire et al.
2018)
132
S. Colombano et al.
DNAPL droplets were observed in soils treated with surfactant foam flushing.
For technical reasons, the foam was injected successively into two sleeve pipes
followed by injections into two others. This implied a reduced DNAPL convergence
toward the recovery wells. Moreover, the actual quantities of DNAPL recovered in
recovery wells were difficult to quantify.
It is believed that the quantities of recovered DNAPL as measured by pressure
sensors were underestimated. Other measurement systems such as bailers or other
sampling tools must be used to better determine the quantities of DNAPL recovered
by surfactant foam flushing.
h
water (m)
h
DNAPL (m)
-0.5
-0.0
-0.5
-1.0
-0.2
-0.3
-0.1 -0.0 -0.1
Injection
Sleeve Pipe A
Sleeve Pipe C
Sleeve Pipe B
Sleeve Pipe D
0
1
2
3
4
5
0
1
2
3
4
5
0
1
2
3
4
5
Time (days)
Solution
Gaz
Fig. 2.61 Variation of the water table and DNAPL interface levels in the recovery well during the
foam injection test (the spike during Day 3 is due to water injected for pipe cleaning) (Maire et al.
2018)
132
S. Colombano et al.