

On Day 1, the foam was injected in sleeve pipe A, leading to a decrease in the
recovery well water level, without significantly affecting the DNAPL level. This
may be due to the presence of non-stabilized gas bubbles in the foam which had
reached the pressure sensor measuring the water level.
On Day 2, the injection into sleeve pipe C caused a significant pressure drop as
measured by two sensors. Therefore, the likely conclusion is that the foam reached
the recovery well since low foam density (100 kg m
À3 ) would cause a high-pressure
variation measured by the sensors. The fact that the signal returned to normal
between Days 2 and 3 seems to indicate foam destabilization or DNAPL
accumulation.
When injections started on Day 3, the recorded pressure values gradually
increased. At the end of Day 5, the pressure values recorded by the sensors were
higher than those recorded initially. This is likely due to the presence of DNAPL in
the recovery wells. However, a mix of DNAPL, water, and foams probably coexisted
in the recovery well (Maire et al. 2018).
The pressure sensors reported a pressure increase due to the presence of foams as
observed in the soil samples collected from the target area (silty sands), but also in
the upper layers of gravelly sand. Foam was observed in every bore hole, even in
those located relatively far away from the injection point (particularly in the one
located 1.7 m from the injection points). The injection method therefore led to foam
forming in the sandy layers, which are the targeted treatment zones. The presence of
foam 3 weeks after the injection also showed that the foam has a relatively long
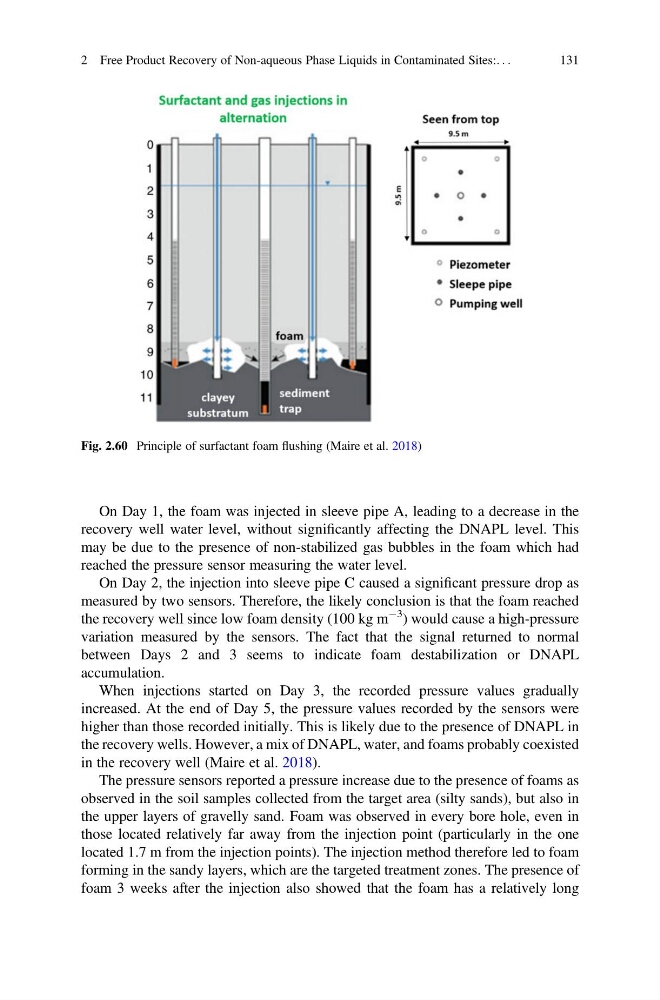
Fig. 2.60 Principle of surfactant foam flushing (Maire et al. 2018)
2 Free Product Recovery of Non-aqueous Phase Liquids in Contaminated Sites:. . .
131
recovery well water level, without significantly affecting the DNAPL level. This
may be due to the presence of non-stabilized gas bubbles in the foam which had
reached the pressure sensor measuring the water level.
On Day 2, the injection into sleeve pipe C caused a significant pressure drop as
measured by two sensors. Therefore, the likely conclusion is that the foam reached
the recovery well since low foam density (100 kg m
À3 ) would cause a high-pressure
variation measured by the sensors. The fact that the signal returned to normal
between Days 2 and 3 seems to indicate foam destabilization or DNAPL
accumulation.
When injections started on Day 3, the recorded pressure values gradually
increased. At the end of Day 5, the pressure values recorded by the sensors were
higher than those recorded initially. This is likely due to the presence of DNAPL in
the recovery wells. However, a mix of DNAPL, water, and foams probably coexisted
in the recovery well (Maire et al. 2018).
The pressure sensors reported a pressure increase due to the presence of foams as
observed in the soil samples collected from the target area (silty sands), but also in
the upper layers of gravelly sand. Foam was observed in every bore hole, even in
those located relatively far away from the injection point (particularly in the one
located 1.7 m from the injection points). The injection method therefore led to foam
forming in the sandy layers, which are the targeted treatment zones. The presence of
foam 3 weeks after the injection also showed that the foam has a relatively long
Fig. 2.60 Principle of surfactant foam flushing (Maire et al. 2018)
2 Free Product Recovery of Non-aqueous Phase Liquids in Contaminated Sites:. . .
131