

Groundwater
water table
DNAPL level
sensor
SUBSTRATUM
SUBSTRATUM
2 m
3 m
200 mm
DNAPL
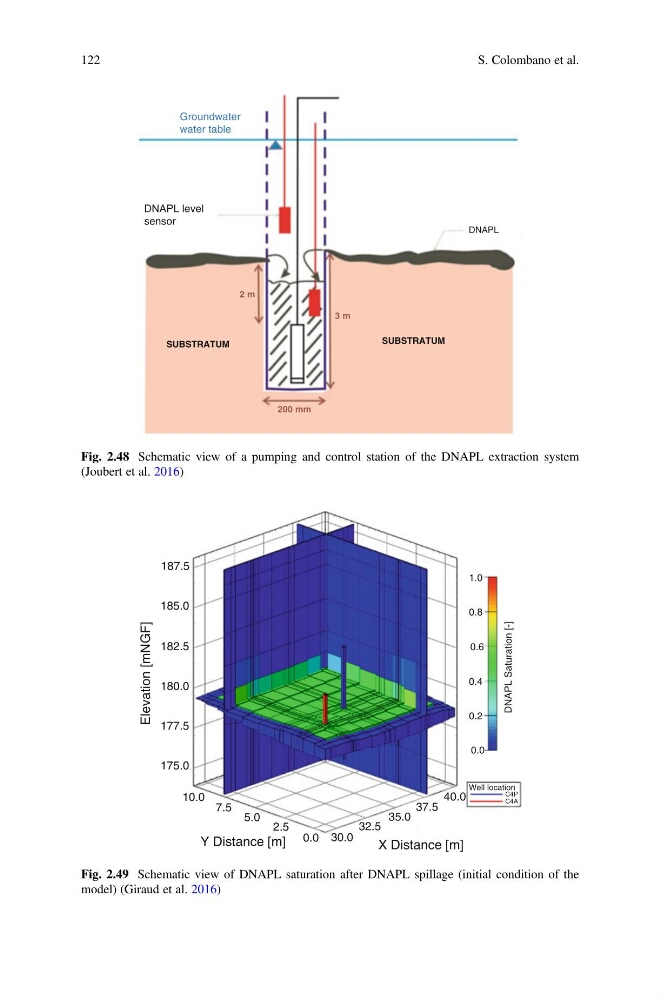
Fig. 2.48 Schematic view of a pumping and control station of the DNAPL extraction system
(Joubert et al. 2016)
187.5
180.0
182.5
185.0
177.5
175.0
10.0
7.5
5.0
2.5
0.0 30.0
32.5
35.0
37.5
40.0
Well location
C4P
C4A
0.0
0.2
0.4
0.6
0.8
1.0
DNAPL Saturation [-]
X Distance [m]
Y Distance [m]
Elevation [mNGF]
Fig. 2.49 Schematic view of DNAPL saturation after DNAPL spillage (initial condition of the
model) (Giraud et al. 2016)
122
S. Colombano et al.
water table
DNAPL level
sensor
SUBSTRATUM
SUBSTRATUM
2 m
3 m
200 mm
DNAPL
Fig. 2.48 Schematic view of a pumping and control station of the DNAPL extraction system
(Joubert et al. 2016)
187.5
180.0
182.5
185.0
177.5
175.0
10.0
7.5
5.0
2.5
0.0 30.0
32.5
35.0
37.5
40.0
Well location
C4P
C4A
0.0
0.2
0.4
0.6
0.8
1.0
DNAPL Saturation [-]
X Distance [m]
Y Distance [m]
Elevation [mNGF]
Fig. 2.49 Schematic view of DNAPL saturation after DNAPL spillage (initial condition of the
model) (Giraud et al. 2016)
122
S. Colombano et al.