

behavior of the remaining DNAPL phases. These tests aimed to determine the
optimum pumping flow rate to achieve the most DNAPL accumulation at the
pumping wells. The water pumped in the recovery well was reinjected at the same
flow rate into each of the four monitoring wells. Reinjection was performed in the
lower part of the piezometer (isolated using packers).
The configurations for conventional free product recovery and free product
recovery with upwelling are shown in Figs. 2.51 and 2.52, respectively. In order
to test the efficiency of both techniques, the experimental studies were performed in
a 2D tank at laboratory scale.
Figure 2.53 shows monitored groundwater level and DNAPL/water interface
level in the recovery well during testing (in the C4 compartment).
In total, four different water flow rates were applied: 7.2, 2.4, 4.8, and 7.8 m
3 h
À1 .
The effect of pumping underlying groundwater on the rise of DNAPL/water interface was clearly observed. Indeed, a first test was performed at a groundwater
pumping flow of 7.2 m
3 h
À1 : this created a groundwater drop of 3 m, and a water/
DNAPL interface rise of about 1 m (this level continuously changed over time
during the test).
Pumping at 7.2 m
3 h
À1 was then suspended to allow a static level to stabilize
before proceeding with a pumping rate of 2.4 m
3 h
À1 . During this short interruption,
the water/DNAPL interface level decreased very slightly. When the next plateau was
set, the interface rose again in spite of the pumping flow rate, and the groundwater
level only dropped by 1 m.
The next plateau, at a higher flow rate of 4.8 m
3 h
À1 , caused a drop of about
1.75 m and the water/DNAPL interface rose by a few tens of centimeters. Finally, the
21/07/2015
04/08/2015 18/08/2015 01/09/2015 15/09/2015 29/09/2015 13/10/2015 27/10/2015
Field Data Simulation Data
Cumulated volume of pumped DNAPL (m 3
)
0
5
10
15
20
25
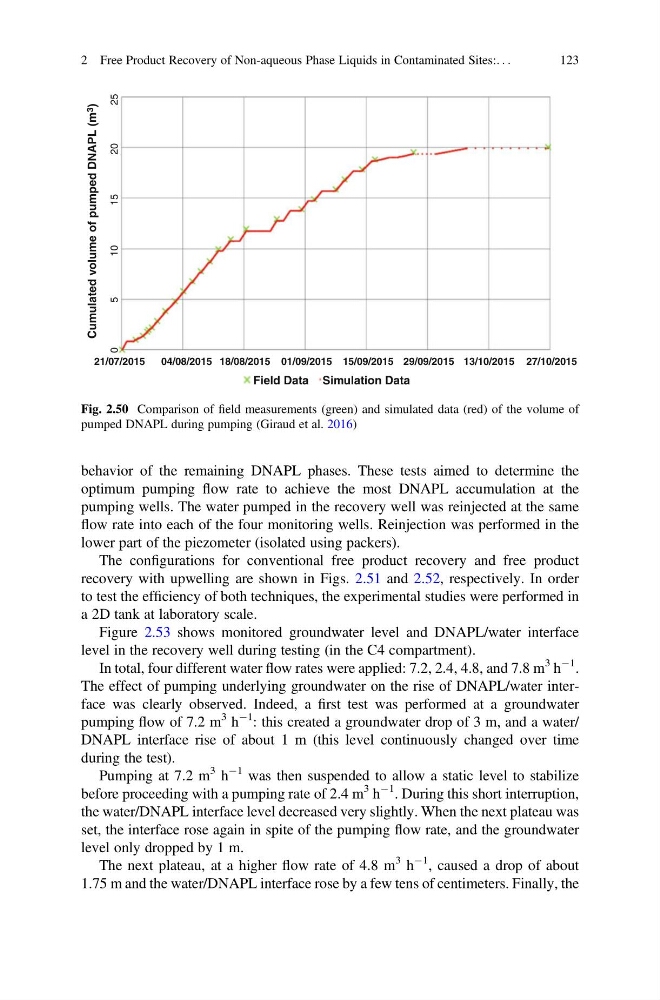
Fig. 2.50 Comparison of field measurements (green) and simulated data (red) of the volume of
pumped DNAPL during pumping (Giraud et al. 2016)
2 Free Product Recovery of Non-aqueous Phase Liquids in Contaminated Sites:. . .
123
optimum pumping flow rate to achieve the most DNAPL accumulation at the
pumping wells. The water pumped in the recovery well was reinjected at the same
flow rate into each of the four monitoring wells. Reinjection was performed in the
lower part of the piezometer (isolated using packers).
The configurations for conventional free product recovery and free product
recovery with upwelling are shown in Figs. 2.51 and 2.52, respectively. In order
to test the efficiency of both techniques, the experimental studies were performed in
a 2D tank at laboratory scale.
Figure 2.53 shows monitored groundwater level and DNAPL/water interface
level in the recovery well during testing (in the C4 compartment).
In total, four different water flow rates were applied: 7.2, 2.4, 4.8, and 7.8 m
3 h
À1 .
The effect of pumping underlying groundwater on the rise of DNAPL/water interface was clearly observed. Indeed, a first test was performed at a groundwater
pumping flow of 7.2 m
3 h
À1 : this created a groundwater drop of 3 m, and a water/
DNAPL interface rise of about 1 m (this level continuously changed over time
during the test).
Pumping at 7.2 m
3 h
À1 was then suspended to allow a static level to stabilize
before proceeding with a pumping rate of 2.4 m
3 h
À1 . During this short interruption,
the water/DNAPL interface level decreased very slightly. When the next plateau was
set, the interface rose again in spite of the pumping flow rate, and the groundwater
level only dropped by 1 m.
The next plateau, at a higher flow rate of 4.8 m
3 h
À1 , caused a drop of about
1.75 m and the water/DNAPL interface rose by a few tens of centimeters. Finally, the
21/07/2015
04/08/2015 18/08/2015 01/09/2015 15/09/2015 29/09/2015 13/10/2015 27/10/2015
Field Data Simulation Data
Cumulated volume of pumped DNAPL (m 3
)
0
5
10
15
20
25
Fig. 2.50 Comparison of field measurements (green) and simulated data (red) of the volume of
pumped DNAPL during pumping (Giraud et al. 2016)
2 Free Product Recovery of Non-aqueous Phase Liquids in Contaminated Sites:. . .
123