

formation of ganglions (DNAPL in the form of residual saturation). The DNAPL
extraction flow rate was therefore set to the DNAPL collector’s feed flow rate, which
is based on a reptation phenomenon that cannot be accelerated (though it does
potentially occur during the upwelling phases). To achieve this, the height of the
water/DNAPL interface had to be maintained above the side of the clay layer at the
pumping well (Joubert et al. 2016).
The first pumping test was conducted conventionally (i.e., Pumping DNAPL
alone). The TMVOC software program was used for multiphase flow modeling of
this pumping test (Figs. 2.49 and 2.50).
The modeling results clearly reproduce the field observations. The final simulated
volume of pumped DNAPL was 19.90 m
3 , whereas 20.05 m
3 were pumped on site.
2.7.2.3 Free Product Recovery with Upwelling
Once the technical extraction limits were reached by implementing a conventional
free product recovery approach, upwelling tests were conducted to assess the
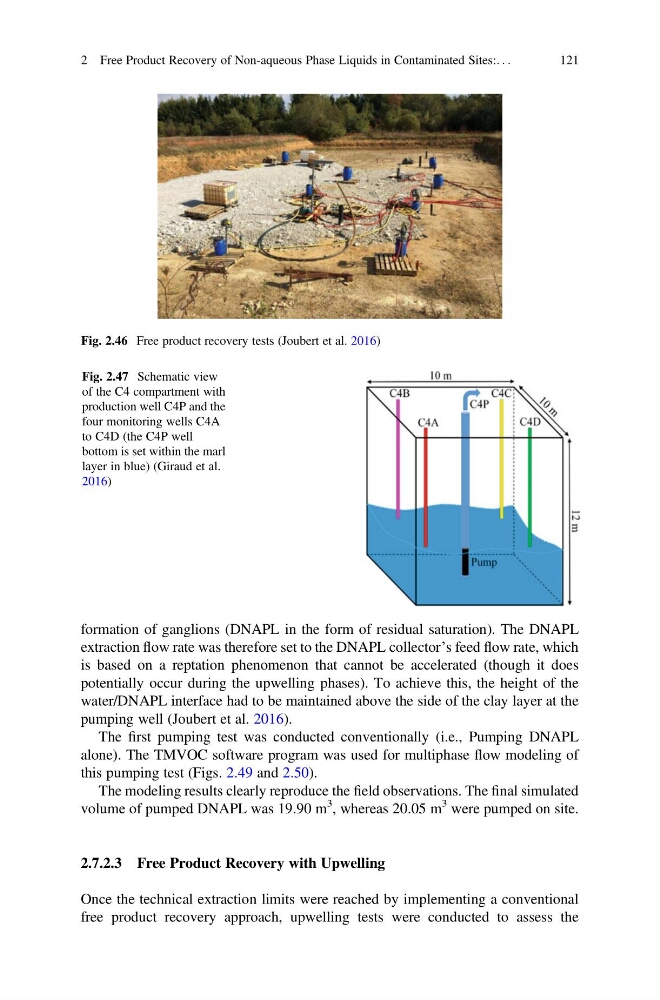
Fig. 2.46 Free product recovery tests (Joubert et al. 2016)
Fig. 2.47 Schematic view
of the C4 compartment with
production well C4P and the
four monitoring wells C4A
to C4D (the C4P well
bottom is set within the marl
layer in blue) (Giraud et al.
2016)
2 Free Product Recovery of Non-aqueous Phase Liquids in Contaminated Sites:. . .
121
extraction flow rate was therefore set to the DNAPL collector’s feed flow rate, which
is based on a reptation phenomenon that cannot be accelerated (though it does
potentially occur during the upwelling phases). To achieve this, the height of the
water/DNAPL interface had to be maintained above the side of the clay layer at the
pumping well (Joubert et al. 2016).
The first pumping test was conducted conventionally (i.e., Pumping DNAPL
alone). The TMVOC software program was used for multiphase flow modeling of
this pumping test (Figs. 2.49 and 2.50).
The modeling results clearly reproduce the field observations. The final simulated
volume of pumped DNAPL was 19.90 m
3 , whereas 20.05 m
3 were pumped on site.
2.7.2.3 Free Product Recovery with Upwelling
Once the technical extraction limits were reached by implementing a conventional
free product recovery approach, upwelling tests were conducted to assess the
Fig. 2.46 Free product recovery tests (Joubert et al. 2016)
Fig. 2.47 Schematic view
of the C4 compartment with
production well C4P and the
four monitoring wells C4A
to C4D (the C4P well
bottom is set within the marl
layer in blue) (Giraud et al.
2016)
2 Free Product Recovery of Non-aqueous Phase Liquids in Contaminated Sites:. . .
121