

182
S. Saalah et al.
23.1
23.8
30.9
25.7
23.4
0.00
5.00
10.00
15.00
20.00
25.00
30.00
35.00
MONDAY
TUESDAY
WEDNESDAY
THURSDAY
FRIDAY
Weight (Kg)
Days
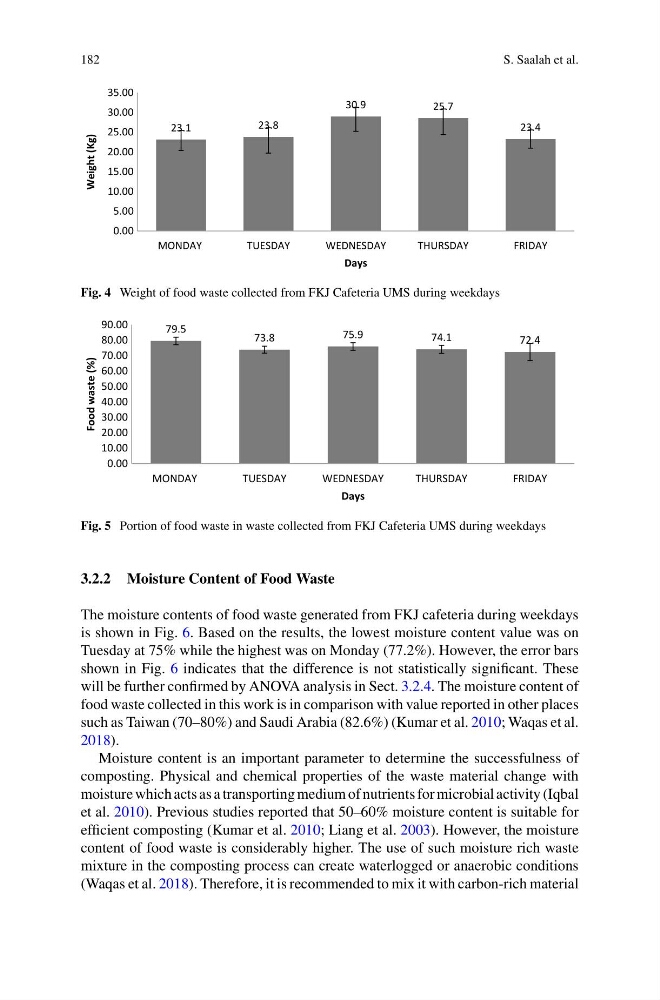
Fig. 4 Weight of food waste collected from FKJ Cafeteria UMS during weekdays
79.5
73.8
75.9
74.1
72.4
0.00
10.00
20.00
30.00
40.00
50.00
60.00
70.00
80.00
90.00
MONDAY
TUESDAY
WEDNESDAY
THURSDAY
FRIDAY
Food waste (%)
Days
Fig. 5 Portion of food waste in waste collected from FKJ Cafeteria UMS during weekdays
3.2.2 Moisture Content of Food Waste
The moisture contents of food waste generated from FKJ cafeteria during weekdays
is shown in Fig. 6. Based on the results, the lowest moisture content value was on
Tuesday at 75% while the highest was on Monday (77.2%). However, the error bars
shown in Fig. 6 indicates that the difference is not statistically significant. These
will be further confirmed by ANOVA analysis in Sect. 3.2.4. The moisture content of
food waste collected in this work is in comparison with value reported in other places
such as Taiwan (70–80%) and Saudi Arabia (82.6%) (Kumar et al. 2010; Waqas et al.
2018).
Moisture content is an important parameter to determine the successfulness of
composting. Physical and chemical properties of the waste material change with
moisture which acts as a transporting medium of nutrients for microbial activity (Iqbal
et al. 2010). Previous studies reported that 50–60% moisture content is suitable for
efficient composting (Kumar et al. 2010; Liang et al. 2003). However, the moisture
content of food waste is considerably higher. The use of such moisture rich waste
mixture in the composting process can create waterlogged or anaerobic conditions
(Waqas et al. 2018). Therefore, it is recommended to mix it with carbon-rich material
S. Saalah et al.
23.1
23.8
30.9
25.7
23.4
0.00
5.00
10.00
15.00
20.00
25.00
30.00
35.00
MONDAY
TUESDAY
WEDNESDAY
THURSDAY
FRIDAY
Weight (Kg)
Days
Fig. 4 Weight of food waste collected from FKJ Cafeteria UMS during weekdays
79.5
73.8
75.9
74.1
72.4
0.00
10.00
20.00
30.00
40.00
50.00
60.00
70.00
80.00
90.00
MONDAY
TUESDAY
WEDNESDAY
THURSDAY
FRIDAY
Food waste (%)
Days
Fig. 5 Portion of food waste in waste collected from FKJ Cafeteria UMS during weekdays
3.2.2 Moisture Content of Food Waste
The moisture contents of food waste generated from FKJ cafeteria during weekdays
is shown in Fig. 6. Based on the results, the lowest moisture content value was on
Tuesday at 75% while the highest was on Monday (77.2%). However, the error bars
shown in Fig. 6 indicates that the difference is not statistically significant. These
will be further confirmed by ANOVA analysis in Sect. 3.2.4. The moisture content of
food waste collected in this work is in comparison with value reported in other places
such as Taiwan (70–80%) and Saudi Arabia (82.6%) (Kumar et al. 2010; Waqas et al.
2018).
Moisture content is an important parameter to determine the successfulness of
composting. Physical and chemical properties of the waste material change with
moisture which acts as a transporting medium of nutrients for microbial activity (Iqbal
et al. 2010). Previous studies reported that 50–60% moisture content is suitable for
efficient composting (Kumar et al. 2010; Liang et al. 2003). However, the moisture
content of food waste is considerably higher. The use of such moisture rich waste
mixture in the composting process can create waterlogged or anaerobic conditions
(Waqas et al. 2018). Therefore, it is recommended to mix it with carbon-rich material