

Food Waste Composting at Faculty of Engineering …
181
Table 4 Waste generation from FKJ Cafeteria UMS
Type of waste
Total cafeteria waste
generated for total four
weeks (kg)
Average cafeteria waste
generated weekly (kg)
Average cafeteria waste
generated daily (kg)
Food waste
510.9
127.7
25.5
Plastic
60.9
15.2
3.0
Paper
47.9
12.0
2.4
Bones
34.1
8.5
1.7
Eggshells
18.4
4.6
0.9
Others
8.0
2.0
0.4
Total
680.2
170
33.9
FOOD WASTE
75%
PLASTIC
9%
PAPER
7%
BONE
5%
EGGSHELL
3%
OTHERS
1%
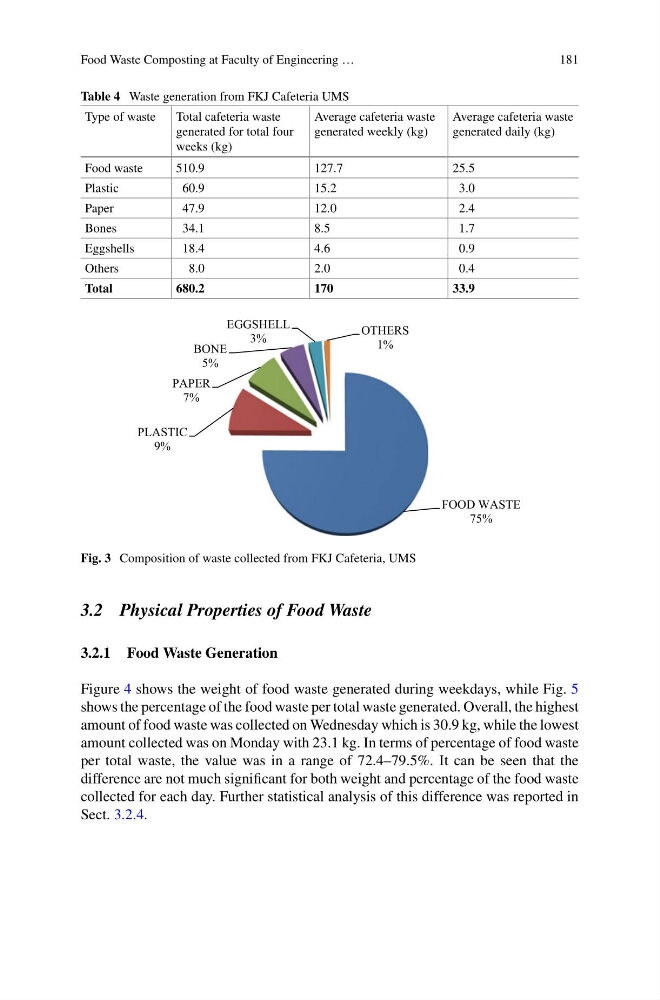
Fig. 3 Composition of waste collected from FKJ Cafeteria, UMS
3.2 Physical Properties of Food Waste
3.2.1 Food Waste Generation
Figure 4 shows the weight of food waste generated during weekdays, while Fig. 5
shows the percentage of the food waste per total waste generated. Overall, the highest
amount of food waste was collected on Wednesday which is 30.9 kg, while the lowest
amount collected was on Monday with 23.1 kg. In terms of percentage of food waste
per total waste, the value was in a range of 72.4–79.5%. It can be seen that the
difference are not much significant for both weight and percentage of the food waste
collected for each day. Further statistical analysis of this difference was reported in
Sect. 3.2.4.
181
Table 4 Waste generation from FKJ Cafeteria UMS
Type of waste
Total cafeteria waste
generated for total four
weeks (kg)
Average cafeteria waste
generated weekly (kg)
Average cafeteria waste
generated daily (kg)
Food waste
510.9
127.7
25.5
Plastic
60.9
15.2
3.0
Paper
47.9
12.0
2.4
Bones
34.1
8.5
1.7
Eggshells
18.4
4.6
0.9
Others
8.0
2.0
0.4
Total
680.2
170
33.9
FOOD WASTE
75%
PLASTIC
9%
PAPER
7%
BONE
5%
EGGSHELL
3%
OTHERS
1%
Fig. 3 Composition of waste collected from FKJ Cafeteria, UMS
3.2 Physical Properties of Food Waste
3.2.1 Food Waste Generation
Figure 4 shows the weight of food waste generated during weekdays, while Fig. 5
shows the percentage of the food waste per total waste generated. Overall, the highest
amount of food waste was collected on Wednesday which is 30.9 kg, while the lowest
amount collected was on Monday with 23.1 kg. In terms of percentage of food waste
per total waste, the value was in a range of 72.4–79.5%. It can be seen that the
difference are not much significant for both weight and percentage of the food waste
collected for each day. Further statistical analysis of this difference was reported in
Sect. 3.2.4.