

180
S. Saalah et al.
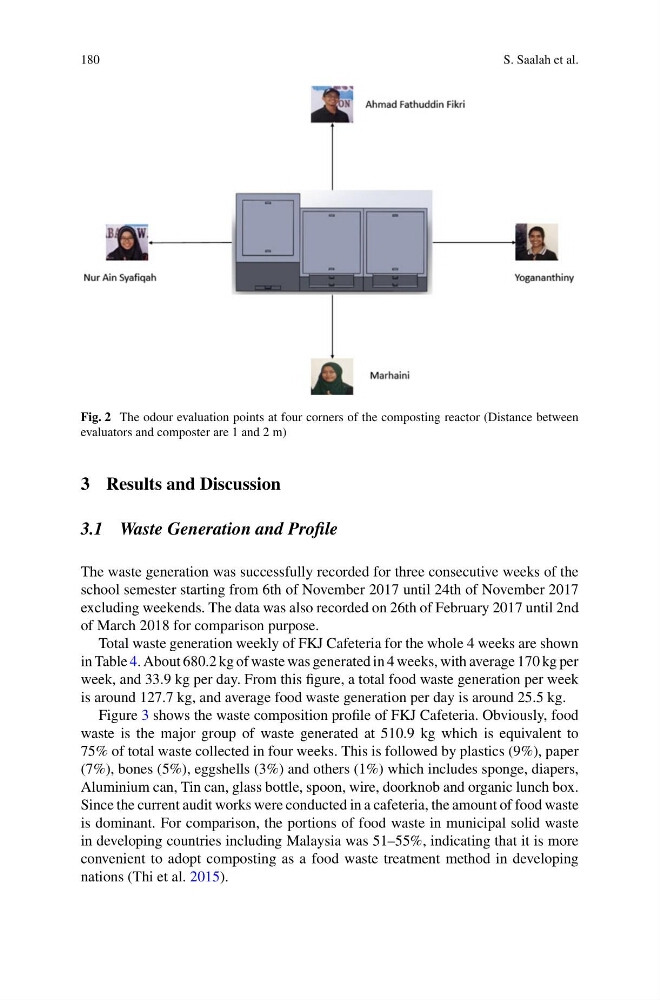
Fig. 2 The odour evaluation points at four corners of the composting reactor (Distance between
evaluators and composter are 1 and 2 m)
3 Results and Discussion
3.1 Waste Generation and Profile
The waste generation was successfully recorded for three consecutive weeks of the
school semester starting from 6th of November 2017 until 24th of November 2017
excluding weekends. The data was also recorded on 26th of February 2017 until 2nd
of March 2018 for comparison purpose.
Total waste generation weekly of FKJ Cafeteria for the whole 4 weeks are shown
in Table 4. About 680.2 kg of waste was generated in 4 weeks, with average 170 kg per
week, and 33.9 kg per day. From this figure, a total food waste generation per week
is around 127.7 kg, and average food waste generation per day is around 25.5 kg.
Figure 3 shows the waste composition profile of FKJ Cafeteria. Obviously, food
waste is the major group of waste generated at 510.9 kg which is equivalent to
75% of total waste collected in four weeks. This is followed by plastics (9%), paper
(7%), bones (5%), eggshells (3%) and others (1%) which includes sponge, diapers,
Aluminium can, Tin can, glass bottle, spoon, wire, doorknob and organic lunch box.
Since the current audit works were conducted in a cafeteria, the amount of food waste
is dominant. For comparison, the portions of food waste in municipal solid waste
in developing countries including Malaysia was 51–55%, indicating that it is more
convenient to adopt composting as a food waste treatment method in developing
nations (Thi et al. 2015).
S. Saalah et al.
Fig. 2 The odour evaluation points at four corners of the composting reactor (Distance between
evaluators and composter are 1 and 2 m)
3 Results and Discussion
3.1 Waste Generation and Profile
The waste generation was successfully recorded for three consecutive weeks of the
school semester starting from 6th of November 2017 until 24th of November 2017
excluding weekends. The data was also recorded on 26th of February 2017 until 2nd
of March 2018 for comparison purpose.
Total waste generation weekly of FKJ Cafeteria for the whole 4 weeks are shown
in Table 4. About 680.2 kg of waste was generated in 4 weeks, with average 170 kg per
week, and 33.9 kg per day. From this figure, a total food waste generation per week
is around 127.7 kg, and average food waste generation per day is around 25.5 kg.
Figure 3 shows the waste composition profile of FKJ Cafeteria. Obviously, food
waste is the major group of waste generated at 510.9 kg which is equivalent to
75% of total waste collected in four weeks. This is followed by plastics (9%), paper
(7%), bones (5%), eggshells (3%) and others (1%) which includes sponge, diapers,
Aluminium can, Tin can, glass bottle, spoon, wire, doorknob and organic lunch box.
Since the current audit works were conducted in a cafeteria, the amount of food waste
is dominant. For comparison, the portions of food waste in municipal solid waste
in developing countries including Malaysia was 51–55%, indicating that it is more
convenient to adopt composting as a food waste treatment method in developing
nations (Thi et al. 2015).