

represented by the map. Differences can arise from variable experimental conditions used from structural determination, distortions
from crystal packing in X-ray crystallography and experimental
noise. Additionally, in single particle cryo-EM experiments, sample
heterogeneity (i.e., the presence of multiple sample conformational
states) can yield multiple maps, for which a single candidate model
cannot usually account for. When the candidate model is generated
by protein structure prediction approaches inaccuracies in the
model, for example, the misassignment of SSEs can also lead to
differences between map and model. Finally, proteins usually
change their conformation due to biomolecular interactions, for
example, to stabilize a protein complex or upon ligand binding.
These conformational changes are commonly facilitated by the
movement of domains and SSEs within proteins via flexible regions.
Thus, if the candidate models are the individual components of a
complex then they are likely to differ in conformation from
corresponding component represented by the map of the intact
complex. Interfaces can be optimized with programs such as HADDOCK or Rosetta. This approach was used to improve the MKLP2
and tubulin interface (PDB ID: 5ND7, 5ND4, 5ND3, EMDB:
3623, 3622, 3621) [22].
To further improve the agreement between the model and the
map flexible fitting (or refinement) methods can be applied. One
approach could be to generate multiple conformations (e.g., by
comparative modeling, ab initio modeling, or molecular dynamics)
and select the conformation that fits best in the density [25, 37, 38]
based on one or more scores (described above). This approach,
which is sometimes necessary at intermediate-to-low resolutions,
was used in the case of the mammalian (PDB ID: 4V5Z, EMDB:
1480) and T. lanuginosus ribosomes (PDB ID: 4V7H, EMDB:
1345) (mentioned above [30, 31]) where for each modeled
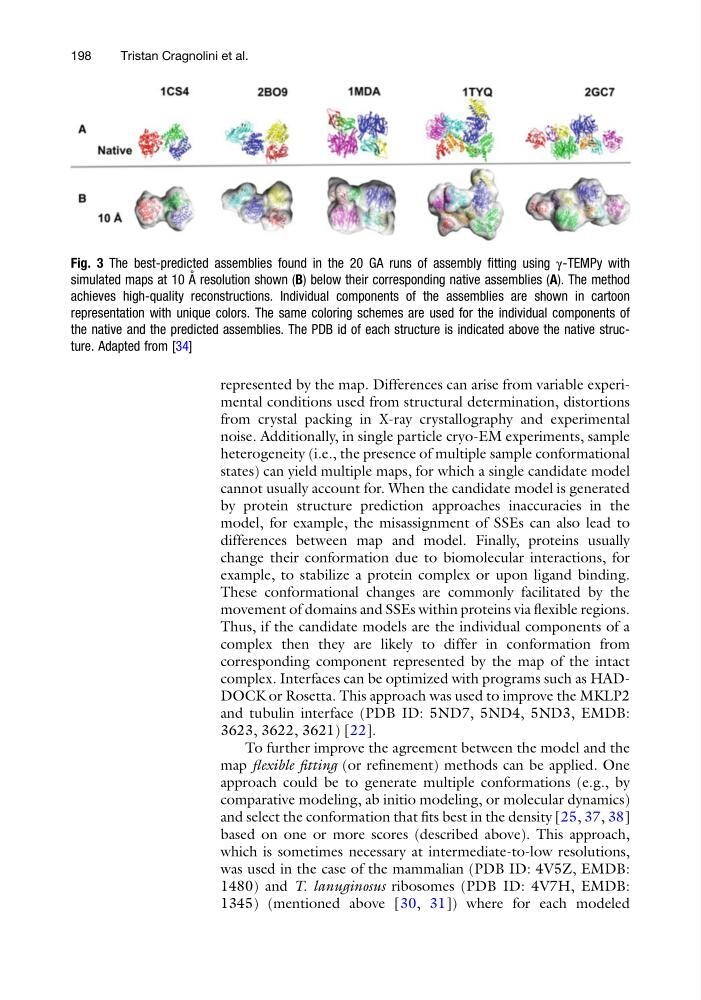
Fig. 3 The best-predicted assemblies found in the 20 GA runs of assembly fitting using γ-TEMPy with
simulated maps at 10 A ˚ resolution shown (B) below their corresponding native assemblies (A). The method
achieves high-quality reconstructions. Individual components of the assemblies are shown in cartoon
representation with unique colors. The same coloring schemes are used for the individual components of
the native and the predicted assemblies. The PDB id of each structure is indicated above the native structure. Adapted from [34]
198
Tristan Cragnolini et al.
from crystal packing in X-ray crystallography and experimental
noise. Additionally, in single particle cryo-EM experiments, sample
heterogeneity (i.e., the presence of multiple sample conformational
states) can yield multiple maps, for which a single candidate model
cannot usually account for. When the candidate model is generated
by protein structure prediction approaches inaccuracies in the
model, for example, the misassignment of SSEs can also lead to
differences between map and model. Finally, proteins usually
change their conformation due to biomolecular interactions, for
example, to stabilize a protein complex or upon ligand binding.
These conformational changes are commonly facilitated by the
movement of domains and SSEs within proteins via flexible regions.
Thus, if the candidate models are the individual components of a
complex then they are likely to differ in conformation from
corresponding component represented by the map of the intact
complex. Interfaces can be optimized with programs such as HADDOCK or Rosetta. This approach was used to improve the MKLP2
and tubulin interface (PDB ID: 5ND7, 5ND4, 5ND3, EMDB:
3623, 3622, 3621) [22].
To further improve the agreement between the model and the
map flexible fitting (or refinement) methods can be applied. One
approach could be to generate multiple conformations (e.g., by
comparative modeling, ab initio modeling, or molecular dynamics)
and select the conformation that fits best in the density [25, 37, 38]
based on one or more scores (described above). This approach,
which is sometimes necessary at intermediate-to-low resolutions,
was used in the case of the mammalian (PDB ID: 4V5Z, EMDB:
1480) and T. lanuginosus ribosomes (PDB ID: 4V7H, EMDB:
1345) (mentioned above [30, 31]) where for each modeled
Fig. 3 The best-predicted assemblies found in the 20 GA runs of assembly fitting using γ-TEMPy with
simulated maps at 10 A ˚ resolution shown (B) below their corresponding native assemblies (A). The method
achieves high-quality reconstructions. Individual components of the assemblies are shown in cartoon
representation with unique colors. The same coloring schemes are used for the individual components of
the native and the predicted assemblies. The PDB id of each structure is indicated above the native structure. Adapted from [34]
198
Tristan Cragnolini et al.