

5. Press the “Set” button. This will set the full range of voxel
values within the local resolution volume file. Chimera automatically estimates these based on their range within the volume file (see Note 7).
6. Press the “Color” button. This will color the input reconstruction by the local resolution file. There are other options available in the program, which are supplied within the Chimera
documentation.
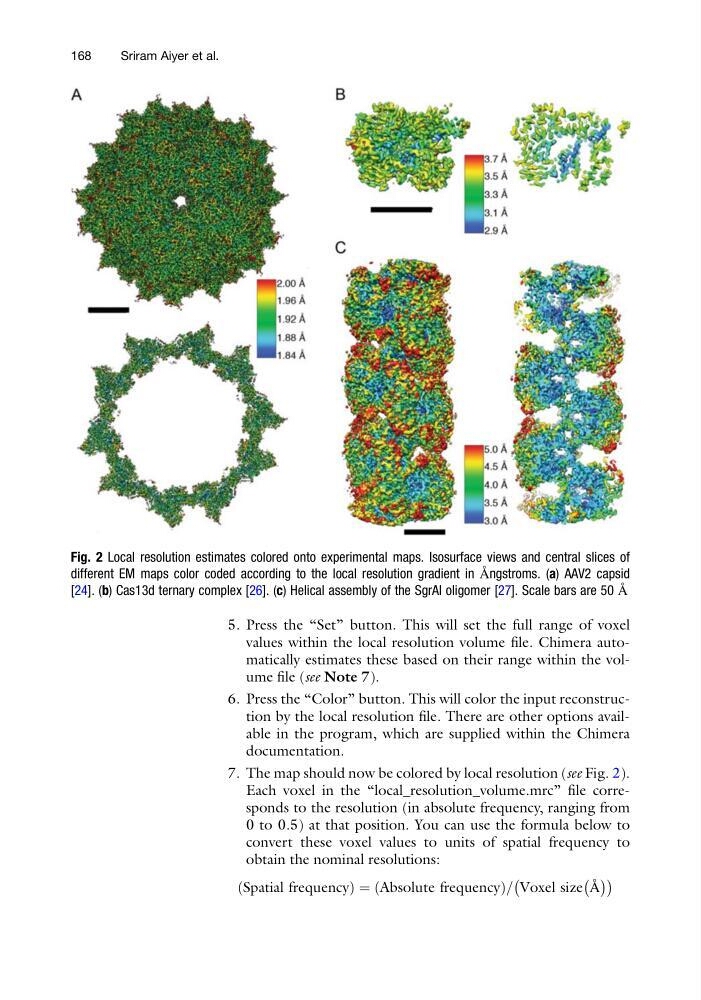
7. The map should now be colored by local resolution (see Fig. 2).
Each voxel in the “local_resolution_volume.mrc” file corresponds to the resolution (in absolute frequency, ranging from
0 to 0.5) at that position. You can use the formula below to
convert these voxel values to units of spatial frequency to
obtain the nominal resolutions:
Spatial frequency
ð
Þ ¼Absolute frequency
ð
Þ = Voxel size Å
À Á
À
Á
Fig. 2 Local resolution estimates colored onto experimental maps. Isosurface views and central slices of
different EM maps color coded according to the local resolution gradient in Ångstroms. (a) AAV2 capsid
[24]. (b) Cas13d ternary complex [26]. (c) Helical assembly of the SgrAI oligomer [27]. Scale bars are 50 Å
168
Sriram Aiyer et al.
values within the local resolution volume file. Chimera automatically estimates these based on their range within the volume file (see Note 7).
6. Press the “Color” button. This will color the input reconstruction by the local resolution file. There are other options available in the program, which are supplied within the Chimera
documentation.
7. The map should now be colored by local resolution (see Fig. 2).
Each voxel in the “local_resolution_volume.mrc” file corresponds to the resolution (in absolute frequency, ranging from
0 to 0.5) at that position. You can use the formula below to
convert these voxel values to units of spatial frequency to
obtain the nominal resolutions:
Spatial frequency
ð
Þ ¼Absolute frequency
ð
Þ = Voxel size Å
À Á
À
Á
Fig. 2 Local resolution estimates colored onto experimental maps. Isosurface views and central slices of
different EM maps color coded according to the local resolution gradient in Ångstroms. (a) AAV2 capsid
[24]. (b) Cas13d ternary complex [26]. (c) Helical assembly of the SgrAI oligomer [27]. Scale bars are 50 Å
168
Sriram Aiyer et al.