

the estimated coefficients along with their standard errors, derived based on a
bootstrapping procedure with 1500 repetitions.
The results presented in Table 10.7 show that the one-dimensional SFC scale has
a positive and significant positive association with Factor 1, clothing durability and
quality; Factor 2, clothing production; and Factor 4, decisions regarding unused
clothing. The association between the SFC scores and the third SCC factor is only
marginally significant, a result that makes sense considering the fact that Factor
3 pertains for clothing characteristics that do not have any correspondent in food
consumption. Most likely, specific features that are not part of the model, for
example, social norms, group influences, or other variables that deserve further
exploration, mediate the association between the SCC dimensions and SFC scores
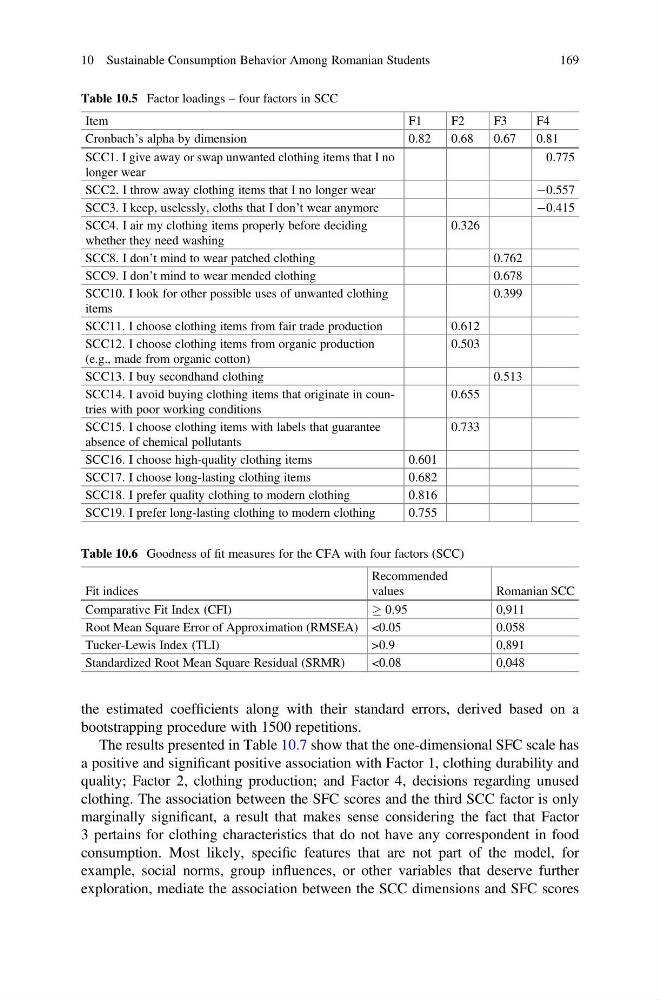
Table 10.5 Factor loadings – four factors in SCC
Item
F1
F2
F3
F4
Cronbach’s alpha by dimension
0.82
0.68
0.67
0.81
SCC1. I give away or swap unwanted clothing items that I no
longer wear
0.775
SCC2. I throw away clothing items that I no longer wear
À0.557
SCC3. I keep, uselessly, cloths that I don’t wear anymore
À0.415
SCC4. I air my clothing items properly before deciding
whether they need washing
0.326
SCC8. I don’t mind to wear patched clothing
0.762
SCC9. I don’t mind to wear mended clothing
0.678
SCC10. I look for other possible uses of unwanted clothing
items
0.399
SCC11. I choose clothing items from fair trade production
0.612
SCC12. I choose clothing items from organic production
(e.g., made from organic cotton)
0.503
SCC13. I buy secondhand clothing
0.513
SCC14. I avoid buying clothing items that originate in countries with poor working conditions
0.655
SCC15. I choose clothing items with labels that guarantee
absence of chemical pollutants
0.733
SCC16. I choose high-quality clothing items
0.601
SCC17. I choose long-lasting clothing items
0.682
SCC18. I prefer quality clothing to modern clothing
0.816
SCC19. I prefer long-lasting clothing to modern clothing
0.755
Table 10.6 Goodness of fit measures for the CFA with four factors (SCC)
Fit indices
Recommended
values
Romanian SCC
Comparative Fit Index (CFI)
! 0.95
0,911
Root Mean Square Error of Approximation (RMSEA) <0.05
0.058
Tucker-Lewis Index (TLI)
>0.9
0,891
Standardized Root Mean Square Residual (SRMR)
<0.08
0,048
10 Sustainable Consumption Behavior Among Romanian Students
169
bootstrapping procedure with 1500 repetitions.
The results presented in Table 10.7 show that the one-dimensional SFC scale has
a positive and significant positive association with Factor 1, clothing durability and
quality; Factor 2, clothing production; and Factor 4, decisions regarding unused
clothing. The association between the SFC scores and the third SCC factor is only
marginally significant, a result that makes sense considering the fact that Factor
3 pertains for clothing characteristics that do not have any correspondent in food
consumption. Most likely, specific features that are not part of the model, for
example, social norms, group influences, or other variables that deserve further
exploration, mediate the association between the SCC dimensions and SFC scores
Table 10.5 Factor loadings – four factors in SCC
Item
F1
F2
F3
F4
Cronbach’s alpha by dimension
0.82
0.68
0.67
0.81
SCC1. I give away or swap unwanted clothing items that I no
longer wear
0.775
SCC2. I throw away clothing items that I no longer wear
À0.557
SCC3. I keep, uselessly, cloths that I don’t wear anymore
À0.415
SCC4. I air my clothing items properly before deciding
whether they need washing
0.326
SCC8. I don’t mind to wear patched clothing
0.762
SCC9. I don’t mind to wear mended clothing
0.678
SCC10. I look for other possible uses of unwanted clothing
items
0.399
SCC11. I choose clothing items from fair trade production
0.612
SCC12. I choose clothing items from organic production
(e.g., made from organic cotton)
0.503
SCC13. I buy secondhand clothing
0.513
SCC14. I avoid buying clothing items that originate in countries with poor working conditions
0.655
SCC15. I choose clothing items with labels that guarantee
absence of chemical pollutants
0.733
SCC16. I choose high-quality clothing items
0.601
SCC17. I choose long-lasting clothing items
0.682
SCC18. I prefer quality clothing to modern clothing
0.816
SCC19. I prefer long-lasting clothing to modern clothing
0.755
Table 10.6 Goodness of fit measures for the CFA with four factors (SCC)
Fit indices
Recommended
values
Romanian SCC
Comparative Fit Index (CFI)
! 0.95
0,911
Root Mean Square Error of Approximation (RMSEA) <0.05
0.058
Tucker-Lewis Index (TLI)
>0.9
0,891
Standardized Root Mean Square Residual (SRMR)
<0.08
0,048
10 Sustainable Consumption Behavior Among Romanian Students
169