

risk of signaling an undesirable social status (item 13), or simply their perception that
doing clothes for themselves involves too much effort, or yields little reward.
Figure (10.3) displays the correlations among items in the initial version of the
scale, showing several patterns with moderate correlations. Based on the graphical
presentation, we expect two to three factors, with one extra factor including some
items with negative correlations (H2 and H3). This number of factors is supported by
the parallel analysis illustrated in Fig. 10.4, where any number between 2 and
5 could be a feasible choice.
We explored different options and found that the best fit corresponds to the four
factors presented in Table (10.5). An aspect to be noticed is that in our explorations,
we found that Factor 1 remains unchanged regardless of the total number of factors
(2, 3, or 4) involved in our exploratory analysis.
The factors illustrated in Table 10.5 explain 35.3% of the overall variance in data,
which is not a good performance, but still the goodness of fit measures presented in
Table 10.6 is pretty good. The uniqueness values are also high for this scale, showing
that despite the decent values recorded for individual loadings, each observable item
in the scale is highly influenced by other variables that are not captured by the
factors. In two cases, high values of uniqueness correspond to the dropped items, for
example, SCC5 (0.894), SCC6 (0.895), and SCC7 (0.984). SCC4, despite its high
uniqueness (0.905), still loads in Factor 2 but with a loading below 0.4. The final
scale derived after dropping irrelevant items is presented in Table (10.5).
The Cronbach’s alpha value for each dimension, as presented on the second line
in Table (10.5), shows that the first and the fourth have a very good internal
consistency, while the second and the third are less reliable. This internal consistency
cannot be further improved by dropping other items. In terms of factor meaning, the
most stable factor across explorations, Factor 1, stands for the durability and quality
of clothes, all four items eliciting loadings over 0.6. The second factor includes items
that refer to clothes production; the only item that is not coherent with the rest of the
items in this factor is SC4. However, as mentioned before, this item has a high
uniqueness, and its loading in this factor is below the often accepted cutoff of 0.4.
The third and fourth factor, including items with loadings over 0.5, stand for
different dimensions of sustainability, related to wasting on the one side and
extending clothe lifecycle through mending, patching, and alternative usage on the
other side. Different patterns are observed also in the case of SCC, by comparison to
the German sample, for which the scale unfolds in only two-factors: sufficiency/
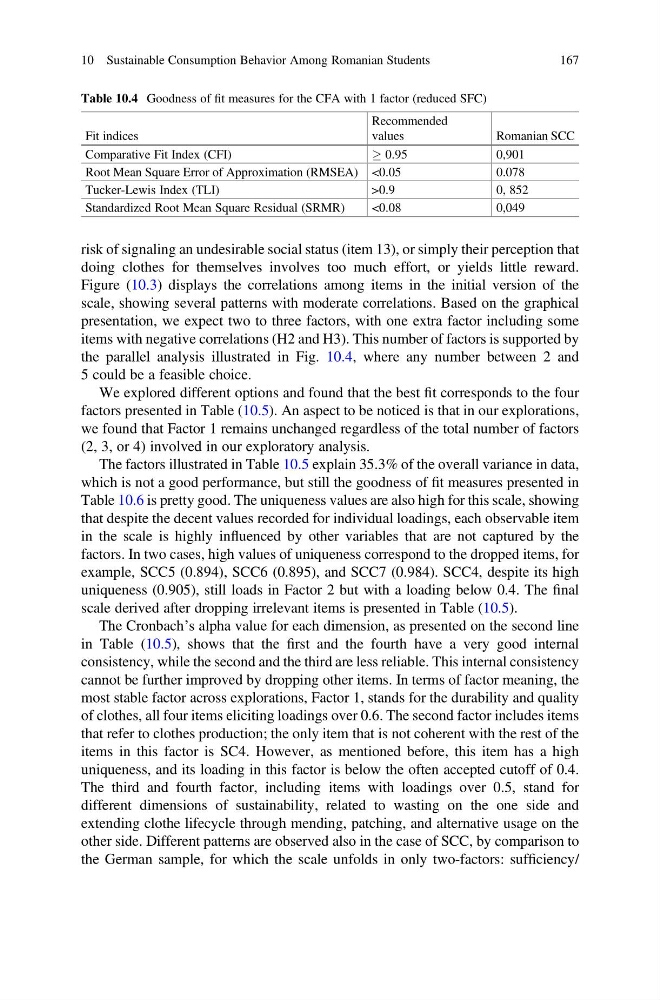
Table 10.4 Goodness of fit measures for the CFA with 1 factor (reduced SFC)
Fit indices
Recommended
values
Romanian SCC
Comparative Fit Index (CFI)
! 0.95
0,901
Root Mean Square Error of Approximation (RMSEA) <0.05
0.078
Tucker-Lewis Index (TLI)
>0.9
0, 852
Standardized Root Mean Square Residual (SRMR)
<0.08
0,049
10 Sustainable Consumption Behavior Among Romanian Students
167
doing clothes for themselves involves too much effort, or yields little reward.
Figure (10.3) displays the correlations among items in the initial version of the
scale, showing several patterns with moderate correlations. Based on the graphical
presentation, we expect two to three factors, with one extra factor including some
items with negative correlations (H2 and H3). This number of factors is supported by
the parallel analysis illustrated in Fig. 10.4, where any number between 2 and
5 could be a feasible choice.
We explored different options and found that the best fit corresponds to the four
factors presented in Table (10.5). An aspect to be noticed is that in our explorations,
we found that Factor 1 remains unchanged regardless of the total number of factors
(2, 3, or 4) involved in our exploratory analysis.
The factors illustrated in Table 10.5 explain 35.3% of the overall variance in data,
which is not a good performance, but still the goodness of fit measures presented in
Table 10.6 is pretty good. The uniqueness values are also high for this scale, showing
that despite the decent values recorded for individual loadings, each observable item
in the scale is highly influenced by other variables that are not captured by the
factors. In two cases, high values of uniqueness correspond to the dropped items, for
example, SCC5 (0.894), SCC6 (0.895), and SCC7 (0.984). SCC4, despite its high
uniqueness (0.905), still loads in Factor 2 but with a loading below 0.4. The final
scale derived after dropping irrelevant items is presented in Table (10.5).
The Cronbach’s alpha value for each dimension, as presented on the second line
in Table (10.5), shows that the first and the fourth have a very good internal
consistency, while the second and the third are less reliable. This internal consistency
cannot be further improved by dropping other items. In terms of factor meaning, the
most stable factor across explorations, Factor 1, stands for the durability and quality
of clothes, all four items eliciting loadings over 0.6. The second factor includes items
that refer to clothes production; the only item that is not coherent with the rest of the
items in this factor is SC4. However, as mentioned before, this item has a high
uniqueness, and its loading in this factor is below the often accepted cutoff of 0.4.
The third and fourth factor, including items with loadings over 0.5, stand for
different dimensions of sustainability, related to wasting on the one side and
extending clothe lifecycle through mending, patching, and alternative usage on the
other side. Different patterns are observed also in the case of SCC, by comparison to
the German sample, for which the scale unfolds in only two-factors: sufficiency/
Table 10.4 Goodness of fit measures for the CFA with 1 factor (reduced SFC)
Fit indices
Recommended
values
Romanian SCC
Comparative Fit Index (CFI)
! 0.95
0,901
Root Mean Square Error of Approximation (RMSEA) <0.05
0.078
Tucker-Lewis Index (TLI)
>0.9
0, 852
Standardized Root Mean Square Residual (SRMR)
<0.08
0,049
10 Sustainable Consumption Behavior Among Romanian Students
167